TL;DR
Most teams still analyze pipelines with brittle SQL, custom scripts, and static dashboards. A new reference architecture shows how schema-driven LLM agents can read workflow provenance in real time—across edge, cloud, and HPC—answering “what/when/who/how” questions, plotting quick diagnostics, and flagging anomalies. The surprising finding: guideline-driven prompting (not just bigger context) is the single highest‑ROI upgrade.
Why this matters (for operators, data leads, and CTOs)
When production AI/data workflows sprawl across services (queues, training jobs, GPUs, file systems), the real telemetry isn’t in your app logs; it’s in the provenance—the metadata of tasks, inputs/outputs, scheduling, and resource usage. Turning that exhaust into live answers is how you:
- Shorten mean‑time‑to‑explain (MTTX) for incidents and drifts.
- Reduce post‑mortem archaeology after failed runs.
- Make compliance and reproducibility checks on demand, not quarterly.
This work proposes a lightweight agent that sits on top of provenance streams and a dynamic schema, so the LLM doesn’t need to ingest your entire database to be useful.
What they actually built
- A reference architecture for a provenance‑aware AI agent that interprets natural‑language questions and returns structured queries, tables, or plots—without coupling the LLM to your raw data volume.
- A dynamic dataflow schema that the agent maintains on the fly from incoming provenance messages, capturing activities, inputs/outputs, and example values.
- A modular toolchain using a streaming hub, a provenance keeper/database, an LLM server, an anomaly detector, and an MCP‑based tool router.
- An evaluation methodology spanning four query classes (what/when/who/how) and both OLTP‑style lookups and OLAP‑style explorations, tested on a synthetic math workflow and a real DFT chemistry workflow.
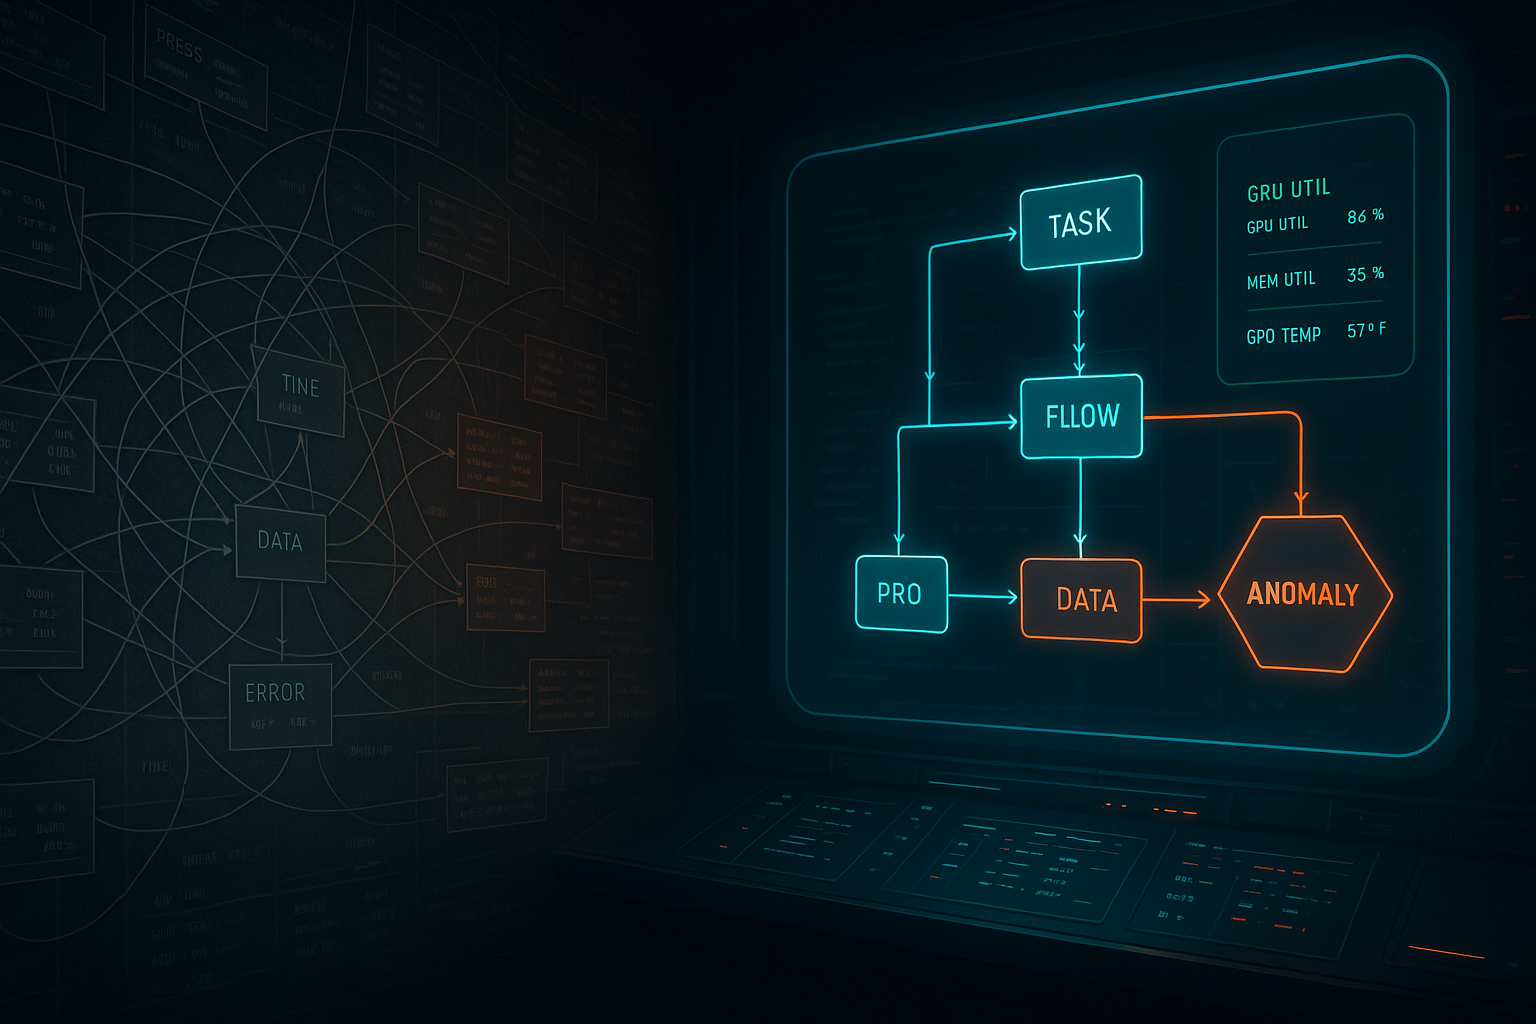
The core idea in one picture
A live provenance stream feeds a Context Manager that keeps two compact structures in memory:
- In‑memory context (recent tasks)
- Dynamic dataflow schema (fields + sample values + inferred types)
When you ask: “Which tasks spiked GPU memory during conformer search on Frontier?” the agent uses guidelines + schema to generate the query code (not a giant data paste), executes locally against the buffer or against the provenance DB, and returns a small table/plot.
Provenance query types (business‑friendly map)
| Axis | Options | Typical questions |
|---|---|---|
| Workload | OLTP lookups | “Show runs for model X after 12:00.” |
| OLAP exploration | “Group by node; find tasks with longest wait time.” | |
| Data type | Control flow | “Which step triggered downstream retries?” |
| Dataflow | “Where did feature drift first appear?” | |
| Scheduling | “Which cluster/node executed failing steps?” | |
| Telemetry | “Plot GPU mem vs. step for last 20 runs.” | |
| Mode | Online | Live monitoring and alerts |
| Offline | Post‑hoc for audits/reproducibility |
What the experiments show (practical takeaways)
- Guidelines beat raw context. Adding crisp, domain‑specific query guidelines delivered the biggest accuracy jump; tossing in more schema/examples helps, but with higher token cost.
- OLTP is easy; OLAP is hard. Simple lookups score near‑perfect. Exploratory, graph‑ish questions (control/dataflow) remain error‑prone—plan for fallback tools and human‑in‑the‑loop.
- Model parity at the top. Frontier models (GPT, Claude) perform similarly at near‑perfect levels with the full setup; smaller open models vary more. Use adaptive routing by query class.
- Interactive latency is fine. Even with full prompts, responses stayed around the “feels live” bar for dashboards.
Implementation sketch (what you’d actually deploy)
- Capture: decorators & observability adapters emit standard provenance messages (task IDs, used/generated payloads, telemetry, timings).
- Stream: Redis/Kafka/Mofka as the streaming hub.
- Persist: keeper normalizes to a PROV‑style schema in Mongo/Neo4j/LMDB.
- Agent: MCP server with a Tool Router, Context Manager, Anomaly Detector, and Guidelines store.
- UI/API: chat UI + HTTP query endpoint; optional Grafana overlay.
Critical design choice: send schema + queries to the LLM, not bulk records. You stay inside context limits and avoid shipping sensitive data.
Where this beats your dashboard
- Natural questions → structured queries → immediate plots.
- Cross‑cutting joins (flow + telemetry + scheduling) without pre‑built panels.
- Explainability trail: every tool call and LLM exchange becomes its own provenance, so you can audit the analysis itself.
Limitations to respect
- Complex multi‑hop graph analysis still benefits from a graph DB + bespoke code.
- Accuracy hinges on good field names and semi‑sane instrumentation.
- OLAP‑heavy analytics still need “classic” data processing alongside the agent.
A 90‑day playbook to pilot this in your stack
Days 1–15: Instrument two pipelines (one synthetic, one real) with minimal field names and consistent units. Days 16–30: Stand up streaming hub + keeper + Mongo/Neo4j; enable an MCP agent with guideline injection. Days 31–60: Build a golden query set of 20–30 questions (mix OLTP/OLAP). Iterate prompts and guidelines weekly. Days 61–90: Add an anomaly detector for telemetry spikes; wire alerting. Trial LLM routing by query class.
Key success metrics: time‑to‑first‑answer (TTFA), guided vs unguided accuracy, % of incidents diagnosed via agent queries, and number of dashboard panels you retire.
What this means for Cognaptus clients
For clients with multi‑stage AI/ETL and GPU training, this agent pattern is a fast path to observability with brains. It cuts through glue‑code debt, makes audits explainable, and keeps context windows small enough for production.
Bottom line: provenance agents are the missing middle layer between raw telemetry and decision‑grade answers.
Cognaptus: Automate the Present, Incubate the Future