In the noisy world of algorithmic trading, volatility is often treated as something to manage or hedge against. But what if it could be a signal generator? Ivan Letteri’s recent paper proposes a novel trading framework that does just that: it treats mid-range volatility not as a nuisance, but as the key to unlocking directional causality between assets.
From Volatility to Causality: The 4-Step Pipeline
This is not your standard volatility arbitrage. The author introduces a four-stage pipeline that transforms volatility clusters into trading signals:
-
Cluster Assets by Volatility: Using the Gaussian Mixture Model (GMM), the system classifies a set of tech and auto stocks into low, medium, and high volatility clusters. The strategy focuses on the medium band—where noise is reduced, but signal remains exploitable.
-
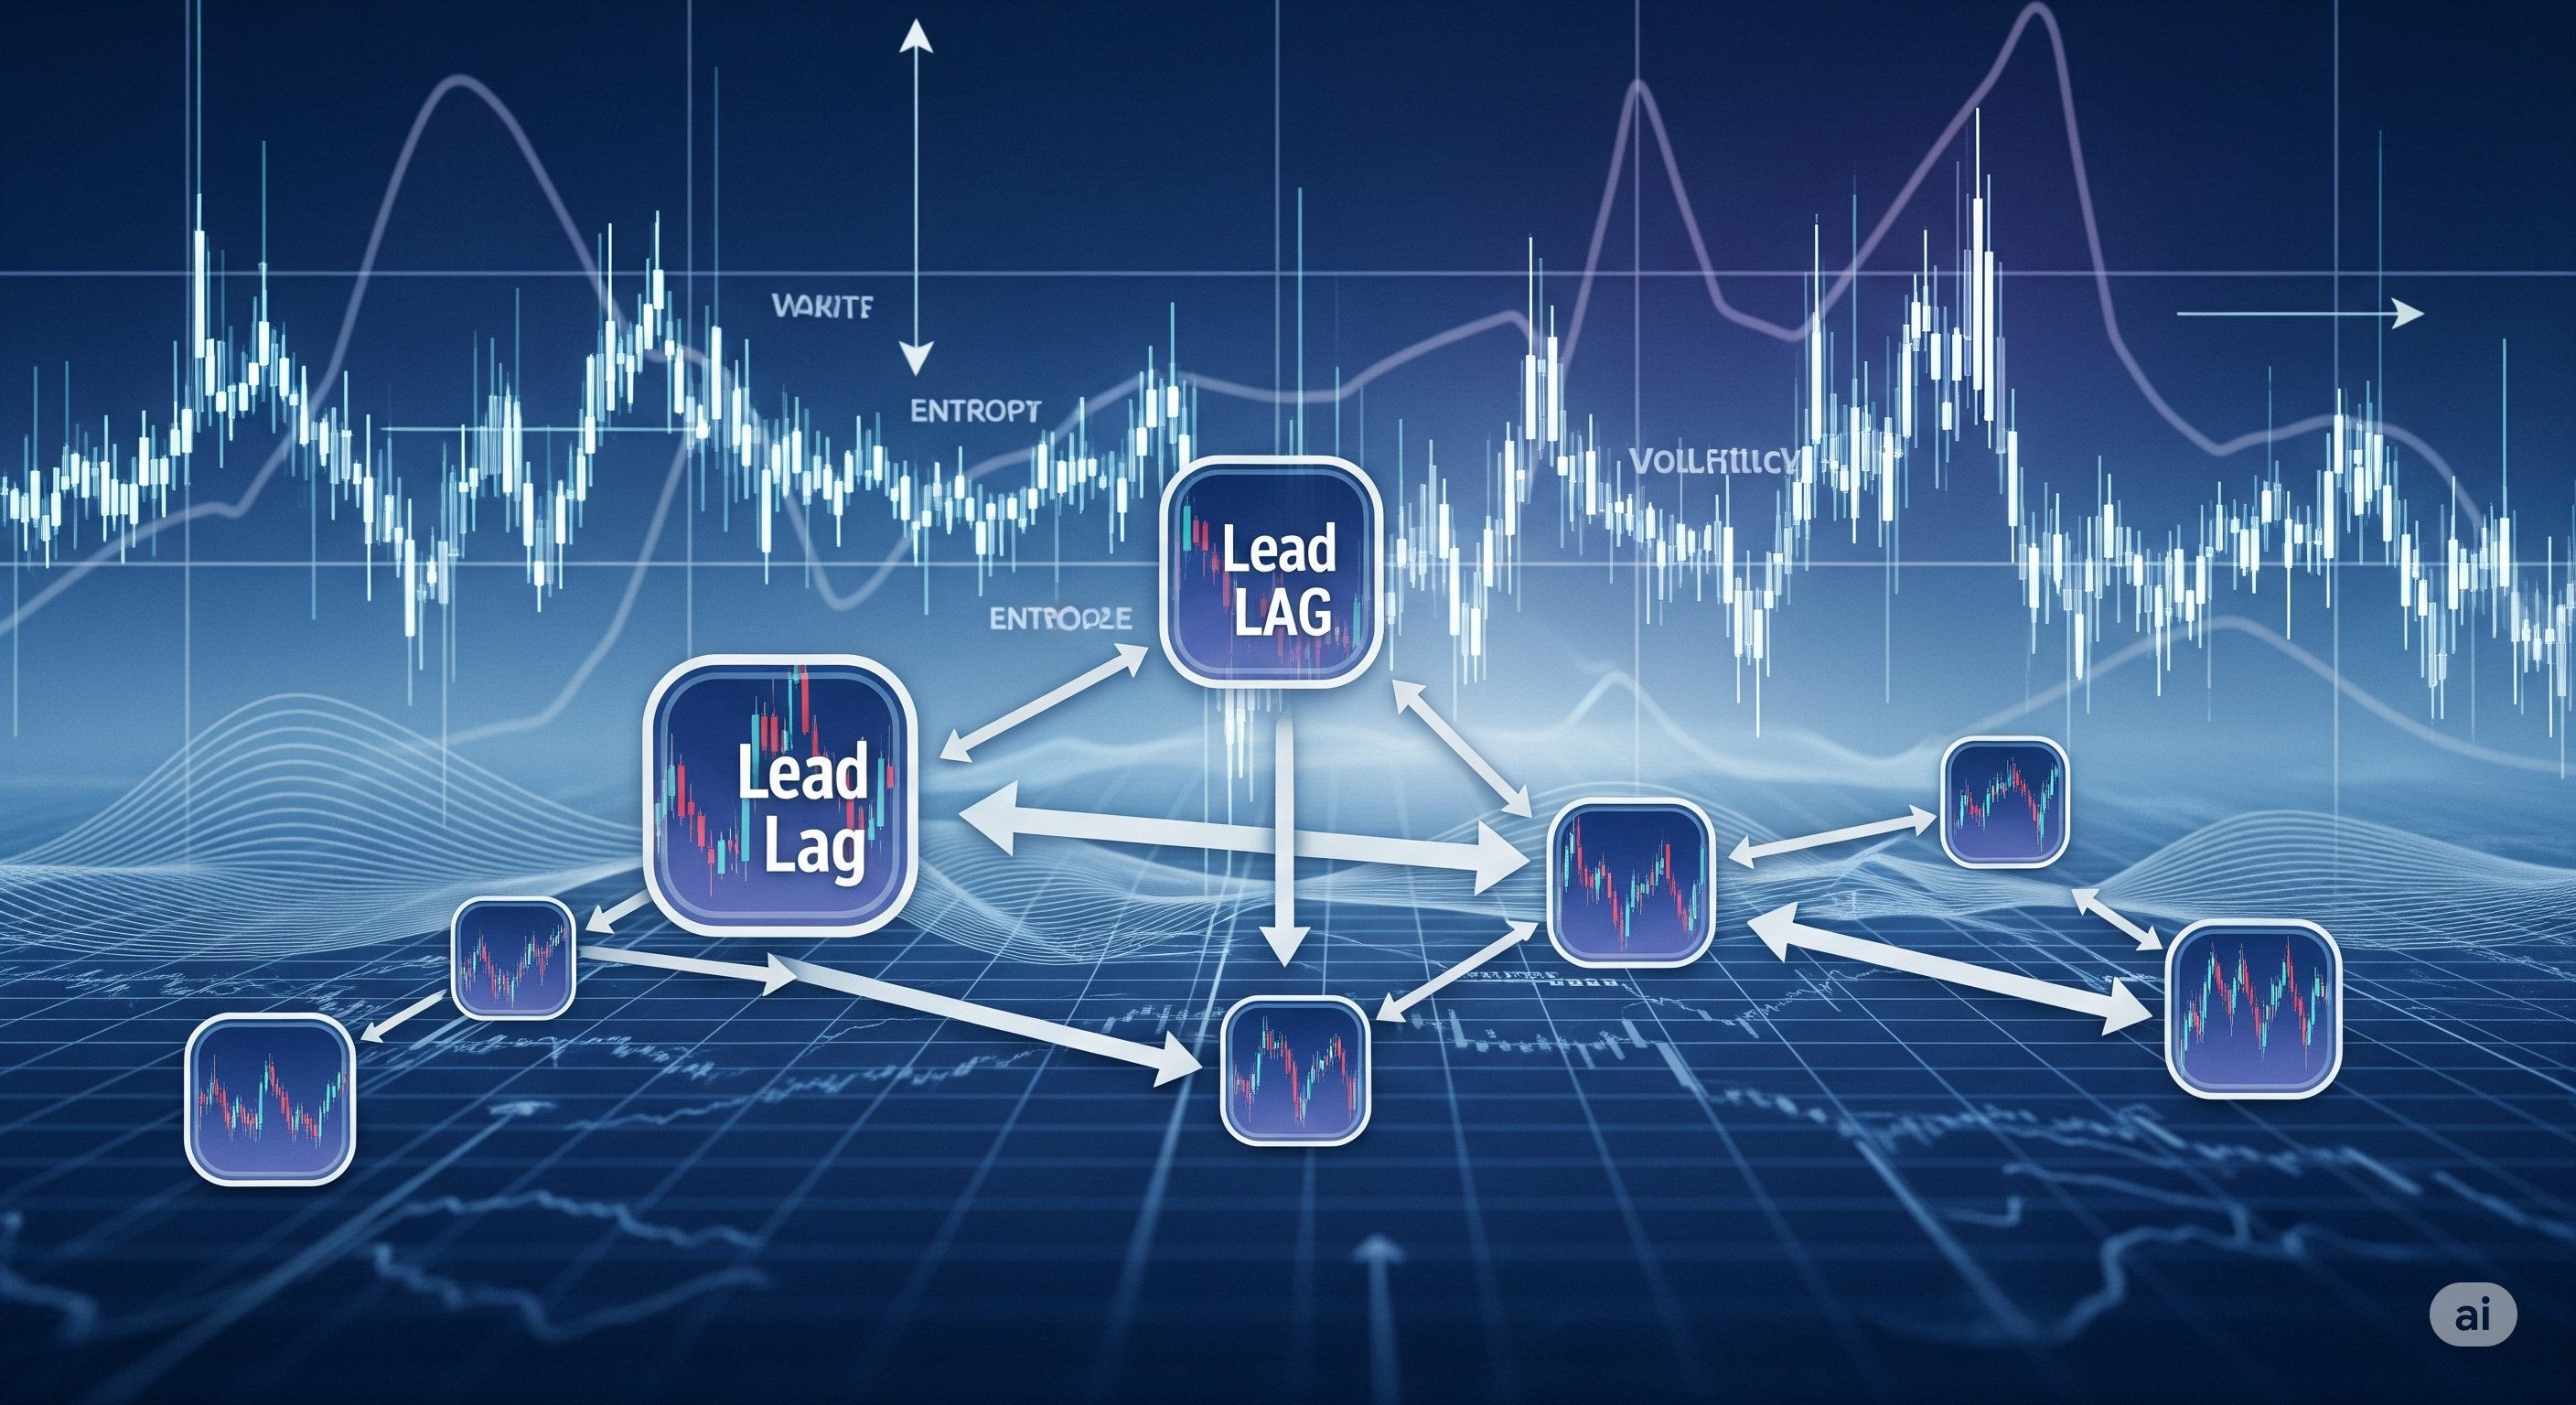
Filter for Predictive Relationships: A causal inference sequence—Granger Causality, a customized Peter-Clark Momentary Conditional Independence (PCMCI) test, and Effective Transfer Entropy (ETE)—systematically isolates directional lead-lag pairs.
-
Find the Optimal Lag: Instead of guessing the reaction time, Dynamic Time Warping (DTW) plus a KNN classifier identify the best delay between the leading and lagging assets.
-
Backtest, Evaluate, Repeat: The strategy trades the lagging asset based on the trend of its leading partner, and results are evaluated using Sharpe, Sortino, Calmar ratios, and win rate.
This multi-stage pipeline functions like a well-oiled filter: statistical noise is successively stripped away, leaving only robust signals that can be profitably traded.
Three Predictive Pairs, Three Mini-Engines
The framework ultimately selects three lead-lag pairs:
| Leader | Follower | Optimal Lag (days) | Win Rate | Return |
|---|---|---|---|---|
| MU | QCOM | 2 | 100% | 15.12% |
| META | TSLA | 1 | 88.6% | 14.51% |
| TSLA | AMZN | 5 | 100% | 16.50% |
Over just 45 days, the strategy returned 15.38%, outperforming a Buy-and-Hold average of 3.65%. Even more impressive: drawdowns were kept under 3%, while the Sharpe and Sortino ratios—particularly for MU → QCOM (SR = 2.17, SoR = 3.93)—were outstanding.
But the real triumph isn’t just return—it’s explanation. The directional causality framework makes the trades more interpretable than, say, a deep-learning black box. META’s daily moves might presage TSLA due to sentiment spillover or shared institutional flows. MU leading QCOM? Perhaps a microchip supply chain proxy. These aren’t arbitrary correlations. They’re hypothesized mechanisms, statistically refined.
Why This Matters: A New Middle Ground
Quantitative strategies often fall into two extremes: simple heuristics that are explainable but brittle, or deep models that perform but mystify. This paper presents a rare middle ground:
- Statistical rigor (Granger, PCMCI, ETE)
- Interpretable logic (lead-lag stock behavior)
- Operational clarity (clear triggers and lags)
And unlike classical pairs trading, which typically targets cointegration and market neutrality, this method embraces directional momentum in the lagging asset. It doesn’t just hedge risk; it seeks alpha.
Caveats and Next Steps
Of course, one must be wary. The backtest is only 45 days long, and the win rates are unrealistically high. The strategy’s real-world viability hinges on further validation over longer and more volatile periods. Also missing: slippage, spreads, and volume constraints. But as a proof-of-concept for causal signal extraction, it’s quite compelling.
Future work could extend this framework with nonlinear causal discovery (e.g., neural Granger, attention-based models) or test it on global multi-asset portfolios. There’s also an opening to mix in unstructured data: could Reddit sentiment be the next causal predictor?
In sum, this framework is less about forecasting prices directly and more about understanding who listens to whom in the market. It is about finding the whisper before the shout.
Cognaptus: Automate the Present, Incubate the Future