Cover image

Seeing Charts Like a Quant: When RL Teaches Vision Models to Actually Reason

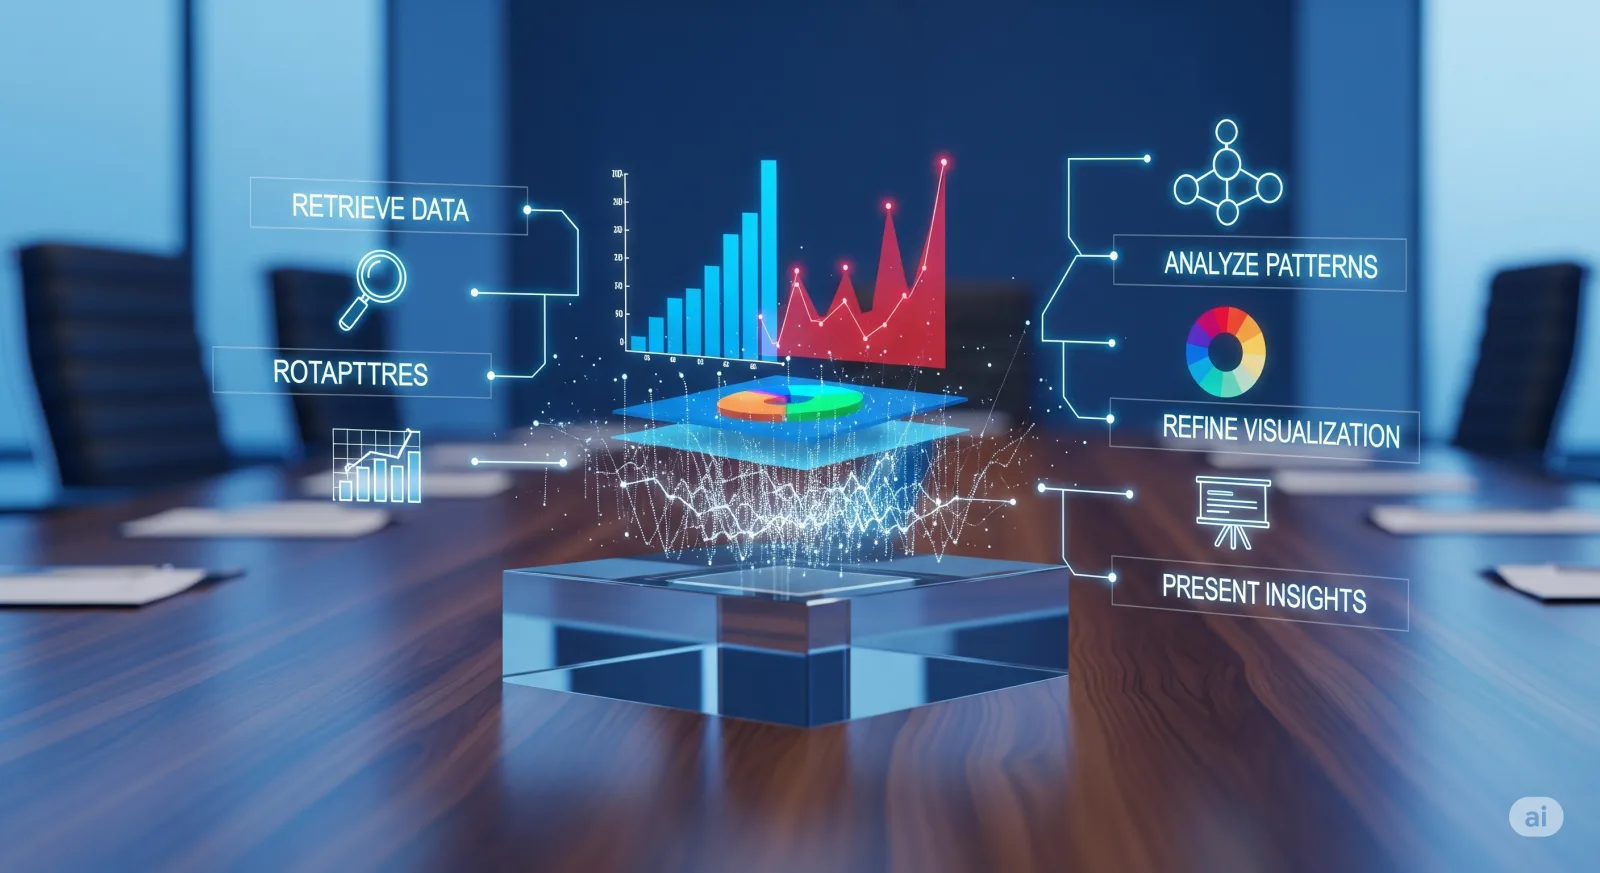
Charts look harmless. A bar chart sits in a dashboard, a line chart appears in a quarterly report, a scatter plot claims there is a relationship, and everyone pretends the machine only needs to “read the image.” This is the polite fiction behind a large share of enterprise AI demos. In practice, chart understanding is not OCR with prettier fonts. A model has to identify the marks, map colors to legends, recover values, decide which numbers matter, perform arithmetic, interpret trends, and then answer the actual question rather than the easier question it secretly substituted. That last step is where many systems go from impressive to quietly expensive. ...


April 6, 2026 · 15 min · Zelina
Cover image

Seeing Is Judging: Why LLMs Are Better Critics Than Creators in Time-Series Reasoning

A dashboard says revenue demand has “stabilized.” A monitoring agent says a sensor spike is “temporary.” A trading assistant says volatility has “fallen after the regime shift.” The sentence is smooth. The chart is nearby. The user is tired. That is usually enough for a bad explanation to survive. This is the quiet problem behind AI-assisted analytics: not whether a language model can write a plausible story about time-series data, but whether the story is faithful to the numbers. A recent paper, LLM-as-a-Judge for Time Series Explanations, studies exactly this gap by asking models to play two different roles: narrator and critic.1 ...

April 4, 2026 · 16 min · Zelina