A diagram is not a paragraph with lines attached.
That sounds obvious, which is usually where software product teams get into trouble. Text can be judged by fluency, relevance, and whether the answer has wandered into confident nonsense. A geometry diagram has extra obligations. The side marked 8 should look longer than the side marked 3. The angle labelled $90^\circ$ should not be having an identity crisis. Labels should sit near the thing they label. The image should not be half outside the frame, unless the product strategy is “modern art, but for sixth grade”.
The paper behind DiagramIR starts from this practical annoyance: large language models can generate TikZ code for educational math diagrams, but evaluating those diagrams at scale is still brittle.1 Human review is reliable but expensive. LLM-as-a-Judge is convenient but, for diagrams, asks the model to reason over code, geometry, layout, and visual proportions all at once. That is not evaluation. That is making the model do a small inspection job while blindfolded and then calling the invoice “automation”.
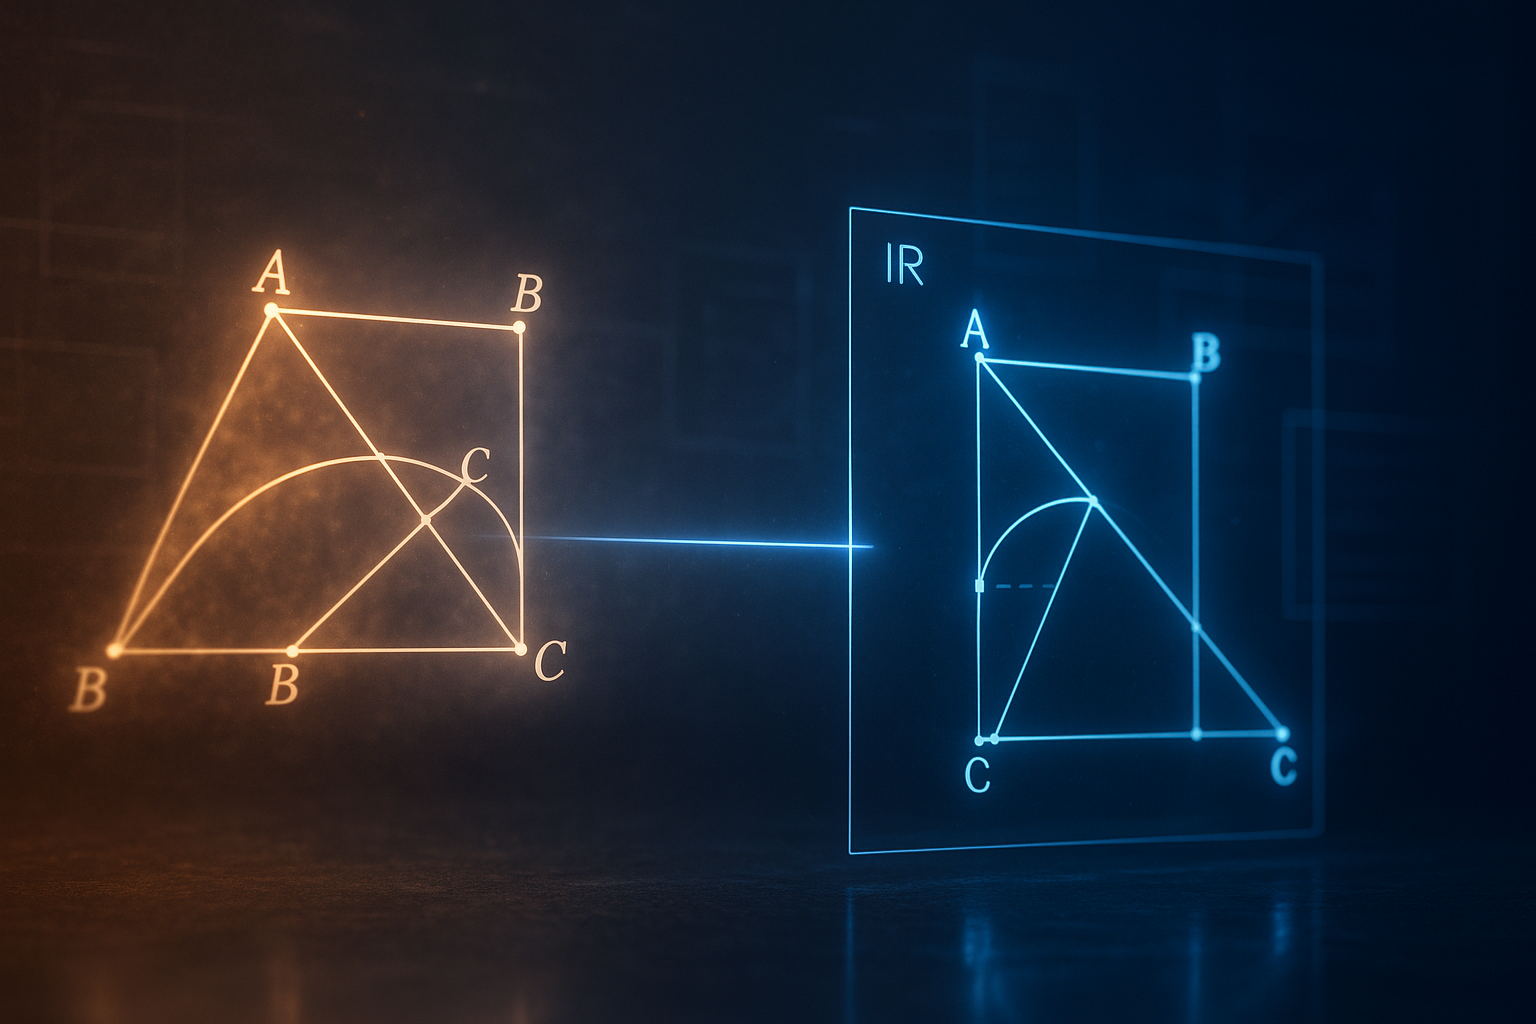
DiagramIR’s more interesting move is not to build a louder judge. It separates perception from verification. First, an LLM converts TikZ code into a structured intermediate representation, or IR. Then deterministic rule-based checks inspect that representation for mathematical and spatial errors. The result is a pipeline that is less glamorous than asking a frontier model to “carefully judge the diagram”, and that is exactly why it matters.
The useful trick is translating before judging
The paper’s central mechanism is back-translation: TikZ code is translated into a lower-entropy, schema-constrained representation before evaluation. TikZ is expressive, flexible, and irritatingly rich. The same diagram can be encoded through different drawing commands, macros, coordinate tricks, loops, scopes, shifts, and stylistic choices. A direct judge sees all of that surface variation and has to infer the underlying geometry.
DiagramIR tries to remove the theatrical fog. It asks an LLM to turn the TikZ into an IR made of explicit objects: nodes, shapes, line segments, arcs, circles, rectangles, 2D coordinates, 3D coordinates, transformations, labels, and related attributes. Once the diagram is expressed this way, rule-based validators can ask narrower questions.
Is every object inside the canvas? Is a label close enough to a plausible line segment, arc, or shape? Do labels and geometry overlap in a way that harms readability? Do numeric labels preserve the visual proportions they claim to describe?
This is not magic. It is software architecture with a ruler.
The distinction matters because the LLM is no longer responsible for the whole judgement. It performs semantic parsing: TikZ $\rightarrow$ IR. The rule system performs verification. That gives the pipeline three business-relevant properties that direct judging struggles to provide: inspectability, reproducibility, and diagnosability. If a diagram fails, the system can say which rule failed. A teacher, product manager, or engineer can see whether the failure was “label too far from arc”, “node exceeds canvas bounds”, or “overlap obscures text”. That is a more useful failure mode than “GPT-5 thought it looked fine”.
The rubric is deliberately narrow, which makes the evidence usable
The authors do not try to evaluate whether a diagram is pedagogically brilliant. Good. That is the kind of target that turns benchmarks into poetry readings.
Instead, they focus on mathematical and spatial soundness. The dataset comes from Coteach, an AI assistant for mathematics educators using the Illustrative Mathematics K–12 Math v.360 curriculum. The authors pulled 6,000 random teacher-tool conversations, identified geometric construction requests as the most frequent diagram category, and sampled 398 geometry diagram instances. These split into 208 2D diagrams, such as triangles, circles, and rectangles, and 190 3D shape diagrams, such as prisms and cubes. Twelve were used for calibration and pipeline development, leaving 386 for the test set.
The rubric covers six checks:
| Category | Check | Operational meaning |
|---|---|---|
| Mathematical correctness | Labeled angles match drawn angles | A labelled angle should correspond to the visible angle or right-angle marker. |
| Mathematical correctness | Labeled lengths or areas match proportions | Numeric side or area labels should be visually consistent with each other. |
| Spatial correctness | Diagram is fully in frame | No relevant object or label should be cut off. |
| Spatial correctness | Elements are scaled to be readable | Objects should not be too small relative to the diagram. |
| Spatial correctness | Labels are associated with correct elements | A label should be close to, or clearly contained by, the intended line, arc, or shape. |
| Spatial correctness | Elements do not problematically overlap | Text and geometry should not collide in ways that harm interpretation. |
This is not the whole of educational quality. It is the part that can be tested without pretending to know whether a child now understands volume. The paper is strongest when read within that boundary.
The appendix makes the dataset’s error profile clearer. Human evaluation found that some errors were relatively common: 23.1% of diagrams had problematic overlap, 13.0% had length or area proportion failures where applicable, and 10.6% were not fully in canvas. Other checks were sparse: only 2.6% had angle-label failures, while 88.1% of diagrams had no applicable angle-label case at all. That matters because agreement scores can be shaped by class imbalance. A validator that looks strong on a rare error is not necessarily a robust teacher’s assistant. It may just be very good at saying “not applicable” while wearing a lab coat.
The main result is better agreement, not perfect judgement
The core comparison pits DiagramIR’s back-translation pipeline against LLM-as-a-Judge. The judge baseline is tested with code and image together, which is the strongest setting the paper reports in the main table. Four models are used: GPT-4.1, GPT-5, GPT-4.1 Mini, and GPT-5 Mini. The main metric is Cohen’s $\kappa$, agreement with human ratings beyond chance.
| Model | Back-translation $\kappa$ | Back-translation cost | Judge $\kappa$ with code + image | Judge cost |
|---|---|---|---|---|
| GPT-4.1 | 0.562 | $6.75 | 0.399 | $3.61 |
| GPT-5 | 0.555 | $10.29 | 0.498 | $4.85 |
| GPT-4.1 Mini | 0.483 | $0.47 | 0.388 | $0.82 |
| GPT-5 Mini | 0.527 | $2.12 | 0.465 | $0.86 |
The headline is straightforward: back-translation achieves higher agreement with human ratings than LLM-as-a-Judge across all four model comparisons in the main setting. But the interesting commercial detail is subtler. DiagramIR does not make every run cheaper or faster. In several same-model comparisons, the back-translation version costs more and takes longer because the model has to produce a structured IR before the rules run.
The business value comes from changing which model is good enough.
GPT-4.1 Mini with back-translation reaches $\kappa = 0.483$, close to GPT-5 as a direct judge at $\kappa = 0.498$, while costing $0.47 rather than $4.85 over the dataset. The authors describe this as about a 10.3x cost reduction. That is the product lesson: structured verification can let a smaller model do useful work because the model is no longer being asked to perform the whole inspection.
This is a familiar pattern in serious AI systems. The best use of a model is often not “decide everything”. It is “extract enough structure so cheaper, testable machinery can decide the parts it is actually good at deciding”. Models are expensive interpreters. Rules are cheap clerks. A sensible pipeline lets each suffer in its own lane.
The check-wise results show where structure helps and where vision still wins
The paper’s most useful evidence is not only the overall $\kappa$ table. The check-wise results explain what DiagramIR is actually good at.
Back-translation performs particularly well on spatial checks. For “diagram fully in frame”, GPT-5 back-translation scores $\kappa = 0.604$, compared with 0.390 for GPT-5 as a code-and-image judge. For “no problematic overlap”, GPT-5 back-translation scores 0.608, while the corresponding judge scores 0.315. For readability, all methods are weaker, but the direct judge can be nearly useless: GPT-4.1 as judge records -0.017, while GPT-4.1 back-translation reaches 0.362.
That is not shocking once the mechanism is understood. Spatial checks benefit from explicit geometry. If the IR contains coordinates, bounding boxes, line segments, arcs, and nodes, then “inside the frame” becomes a geometry problem. “Does this text overlap that line?” becomes a calculable relation. No need to ask a multimodal model to squint politely.
The mathematical label checks are less favourable to DiagramIR. LLM-as-a-Judge outperforms back-translation on angle labels and length or area proportions in the main check-wise table. For angle labels, GPT-5 Mini as judge reaches 0.829, compared with 0.652 for GPT-5 Mini back-translation. The authors plausibly attribute the angle result to the difficulty of programmatically checking angle-label placement relative to surrounding geometric objects. In plain English: some things are easier to see than to reconstruct.
This is the part a careless summary would miss. DiagramIR is not a universal replacement for visual judgement. It is a strong architecture for checks that can be reduced to explicit relations over a structured representation. It is weaker when the relevant judgement depends on visual convention, ambiguous label placement, or geometry that the IR does not capture cleanly.
That distinction should shape deployment. Use the IR pipeline for deterministic layout and consistency checks. Use direct model judgement, human review, or richer vision tools for cases where interpretation depends on visual convention. The correct answer is not “rules beat models”. It is “models should not be forced to do rule work”.
The appendix tests engineering credibility, not a second thesis
The appendix is unusually useful because it shows what kind of result this is.
The code-only and image-only judge comparisons are robustness checks. They ask whether the direct judge improves when it sees different input modalities. The answer is generally no: back-translation remains stronger overall than judge variants supplied only with code or only with image. This supports the mechanism-first claim that the advantage is not merely about giving the judge the wrong input. Even when the direct judge receives image and code, it still struggles on several spatial criteria.
The confusion matrices are error-analysis tools. They show false positives and false negatives by criterion for each back-translation model. This is important operationally because a QA layer can fail in two costly ways. It can block acceptable diagrams, creating friction and manual review load. Or it can pass flawed diagrams, harming trust. For GPT-5 back-translation, across applicable slots, the table reports 185 false positives and 123 false negatives, alongside 152 true positives and 1,888 true negatives. That is not perfection. It is an inspectable error profile.
The IR schema and rule pseudo-code are implementation details, but they are not decorative. They reveal the real cost of the approach: someone has to define the representation, decide which primitives matter, write validators, manage tolerances, and keep the schema aligned with the diagrams the product actually generates. The back-translation prompt even includes detailed instructions for loops, transformations, custom commands, right-angle symbols, and relative coordinates. This is not “just prompt it”. It is a small compiler-adjacent system. Mildly less romantic, much more deployable.
| Paper component | Likely purpose | What it supports | What it does not prove |
|---|---|---|---|
| Main $\kappa$ comparison | Main evidence | Back-translation agrees better with humans overall than direct judging in this dataset. | That the pipeline is accurate enough for every classroom or subject. |
| Code-only and image-only judge tables | Robustness check | The advantage is not simply due to one weak judge input condition. | That all multimodal models will fail similarly in future. |
| Check-wise table | Mechanism diagnosis | IR-based rules help most on spatial/layout checks and less on some mathematical label checks. | That symbolic verification dominates visual reasoning across all diagram tasks. |
| Confusion matrices | Error analysis | The pipeline’s failure modes can be counted and audited. | That false positives or false negatives are already acceptable for production use. |
| IR schema and pseudo-code | Implementation detail | The method is concrete enough to reproduce and extend. | That maintenance will be cheap across wider diagram types. |
The business relevance is a QA layer, not a miracle tutor
For edtech companies, DiagramIR points toward a practical architecture for generated visuals. The diagram generator does not need to be trusted blindly. After generation, a validator can parse the diagram into an IR, run checks, and either pass the diagram, repair it, regenerate it, or escalate it to review.
That workflow has obvious value in teacher-facing tools. A teacher asking for a geometry figure does not want to spend five minutes checking whether the AI placed the label on the wrong edge. The whole point of the tool was to save time, not create a little unpaid quality-assurance internship. A validator that catches common layout and consistency errors before the image is shown could reduce user frustration and increase trust.
The same pattern applies beyond K–12 geometry. Any product that generates structured visual artefacts can benefit from translating messy outputs into auditable representations before judging them. Think charts, technical diagrams, CAD-like sketches, process maps, medical education visuals, or compliance diagrams. The transferable idea is not TikZ itself. It is the decomposition:
- generate a visual artefact;
- translate it into a constrained representation;
- run deterministic checks where possible;
- reserve model judgement or human review for the genuinely interpretive cases.
That said, the paper does not prove broad market readiness. It tests TikZ-generated geometry diagrams from one curriculum context. It does not test freehand sketches, physics diagrams, coordinate plots, multi-step constructions, or diagrams where pedagogical usefulness is the central issue. Nor does it measure whether students learn more from diagrams that pass the checks. Business teams should not confuse “diagram is spatially valid” with “lesson is effective”. The first is a useful gate. The second is a different research programme.
The operational lesson is governance through representation
AI evaluation often gets framed as a model-quality problem: buy a better model, prompt it harder, add reasoning mode, run another judge. DiagramIR suggests a less fashionable answer. Some evaluation problems become easier only after the output is represented in the right form.
That is a governance point. An organisation cannot reliably govern what it cannot inspect. Raw diagram code is hard to inspect. Rendered images are hard to inspect programmatically. A structured IR sits in the middle: expressive enough to preserve relevant geometry, constrained enough for rules to operate, and explicit enough for developers to debug.
This is also where cost control becomes credible. “Use a smaller model” is not a strategy by itself. Smaller models are cheaper because they do less. DiagramIR makes that trade-off viable by reducing the model’s task from judgement to translation. The expensive reasoning is pushed into designed structure and deterministic checks. The model still matters, but it is no longer the sole authority. A surprisingly healthy arrangement, given the species.
For product leaders, the decision framework is simple:
| Question | If yes | If no |
|---|---|---|
| Can the output be converted into a stable schema? | Build an IR or equivalent representation. | Direct judgement may be unavoidable. |
| Are the quality criteria explicit and observable? | Encode them as validators. | Use human review or richer evaluative research. |
| Are failures costly but repetitive? | Automate triage and diagnostics. | Manual review may be sufficient. |
| Does the product need explanations for rejection? | Prefer rule-backed checks. | Black-box scoring may be tolerable. |
DiagramIR sits firmly in the “yes” column for many geometry layout checks. It does not sit there for all educational judgement.
Where the result should not be stretched
The limits are specific, not ceremonial.
First, the rubric excludes prompt alignment and pedagogical usefulness. A diagram can be fully in frame, readable, correctly labelled, and still be the wrong diagram for the lesson. DiagramIR checks whether the visual object is mathematically and spatially sound, not whether it teaches well.
Second, the IR covers a restricted family of geometric primitives and relations. This is appropriate for triangles, rectangles, circles, prisms, and cubes, but wider domains would need schema expansion. A coordinate-plane graph, a physics force diagram, or a multi-step construction may require new primitives, new validators, and new tolerance rules.
Third, the parser is still an LLM. Back-translation can introduce stochastic IR errors. The authors note that fine-tuning a smaller model specifically for TikZ-to-IR translation could reduce cost and improve reliability. That is a sensible next step because the current pipeline’s verification quality depends on whether the upstream representation is faithful.
Fourth, the agreement scores are useful but not overwhelming. A best back-translation $\kappa$ around the mid-0.5 range is meaningful improvement over direct judging, not a certificate of production infallibility. In live educational software, the acceptable threshold depends on the cost of a bad pass, the cost of a false block, and the availability of regeneration or human escalation.
The quiet fix is architectural
DiagramIR is valuable because it resists the lazy instinct to turn every AI quality problem into another model judgement problem. It says: before asking whether the model thinks the diagram is correct, make the diagram legible to software.
That is a small architectural move with large implications. It lowers the burden on expensive models. It makes failures easier to explain. It lets teams encode product-specific quality gates. It also reveals where automation genuinely ends: spatial and mathematical consistency can be checked; pedagogical value still needs richer evidence.
The paper does not announce the end of flawed AI-generated diagrams. It does something more useful. It shows that, in a narrow but commercially relevant slice of educational AI, the path to better outputs may not be a smarter judge. It may be a better intermediate language and a few stubborn rules.
Not glamorous. But then again, neither is quality assurance. That is why it works.
Cognaptus: Automate the Present, Incubate the Future.
-
Vishal Kumar, Shubhra Mishra, Rebecca Hao, Rizwaan Malik, David Broman, and Dorottya Demszky, “DiagramIR: An Automatic Pipeline for Educational Math Diagram Evaluation,” arXiv:2511.08283, 2025, https://arxiv.org/abs/2511.08283. ::: ↩︎