Google’s new in‑production measurement rewrites how we think about the environmental footprint of AI serving—and how to buy it responsibly.
Executive takeaways
- A typical prompt is cheaper than you think—if measured correctly. The median Gemini Apps text prompt (May 2025) used ~0.24 Wh of energy, ~0.03 gCO2e, and ~0.26 mL of water. That’s about the energy of watching ~9 seconds of TV and roughly five drops of water.
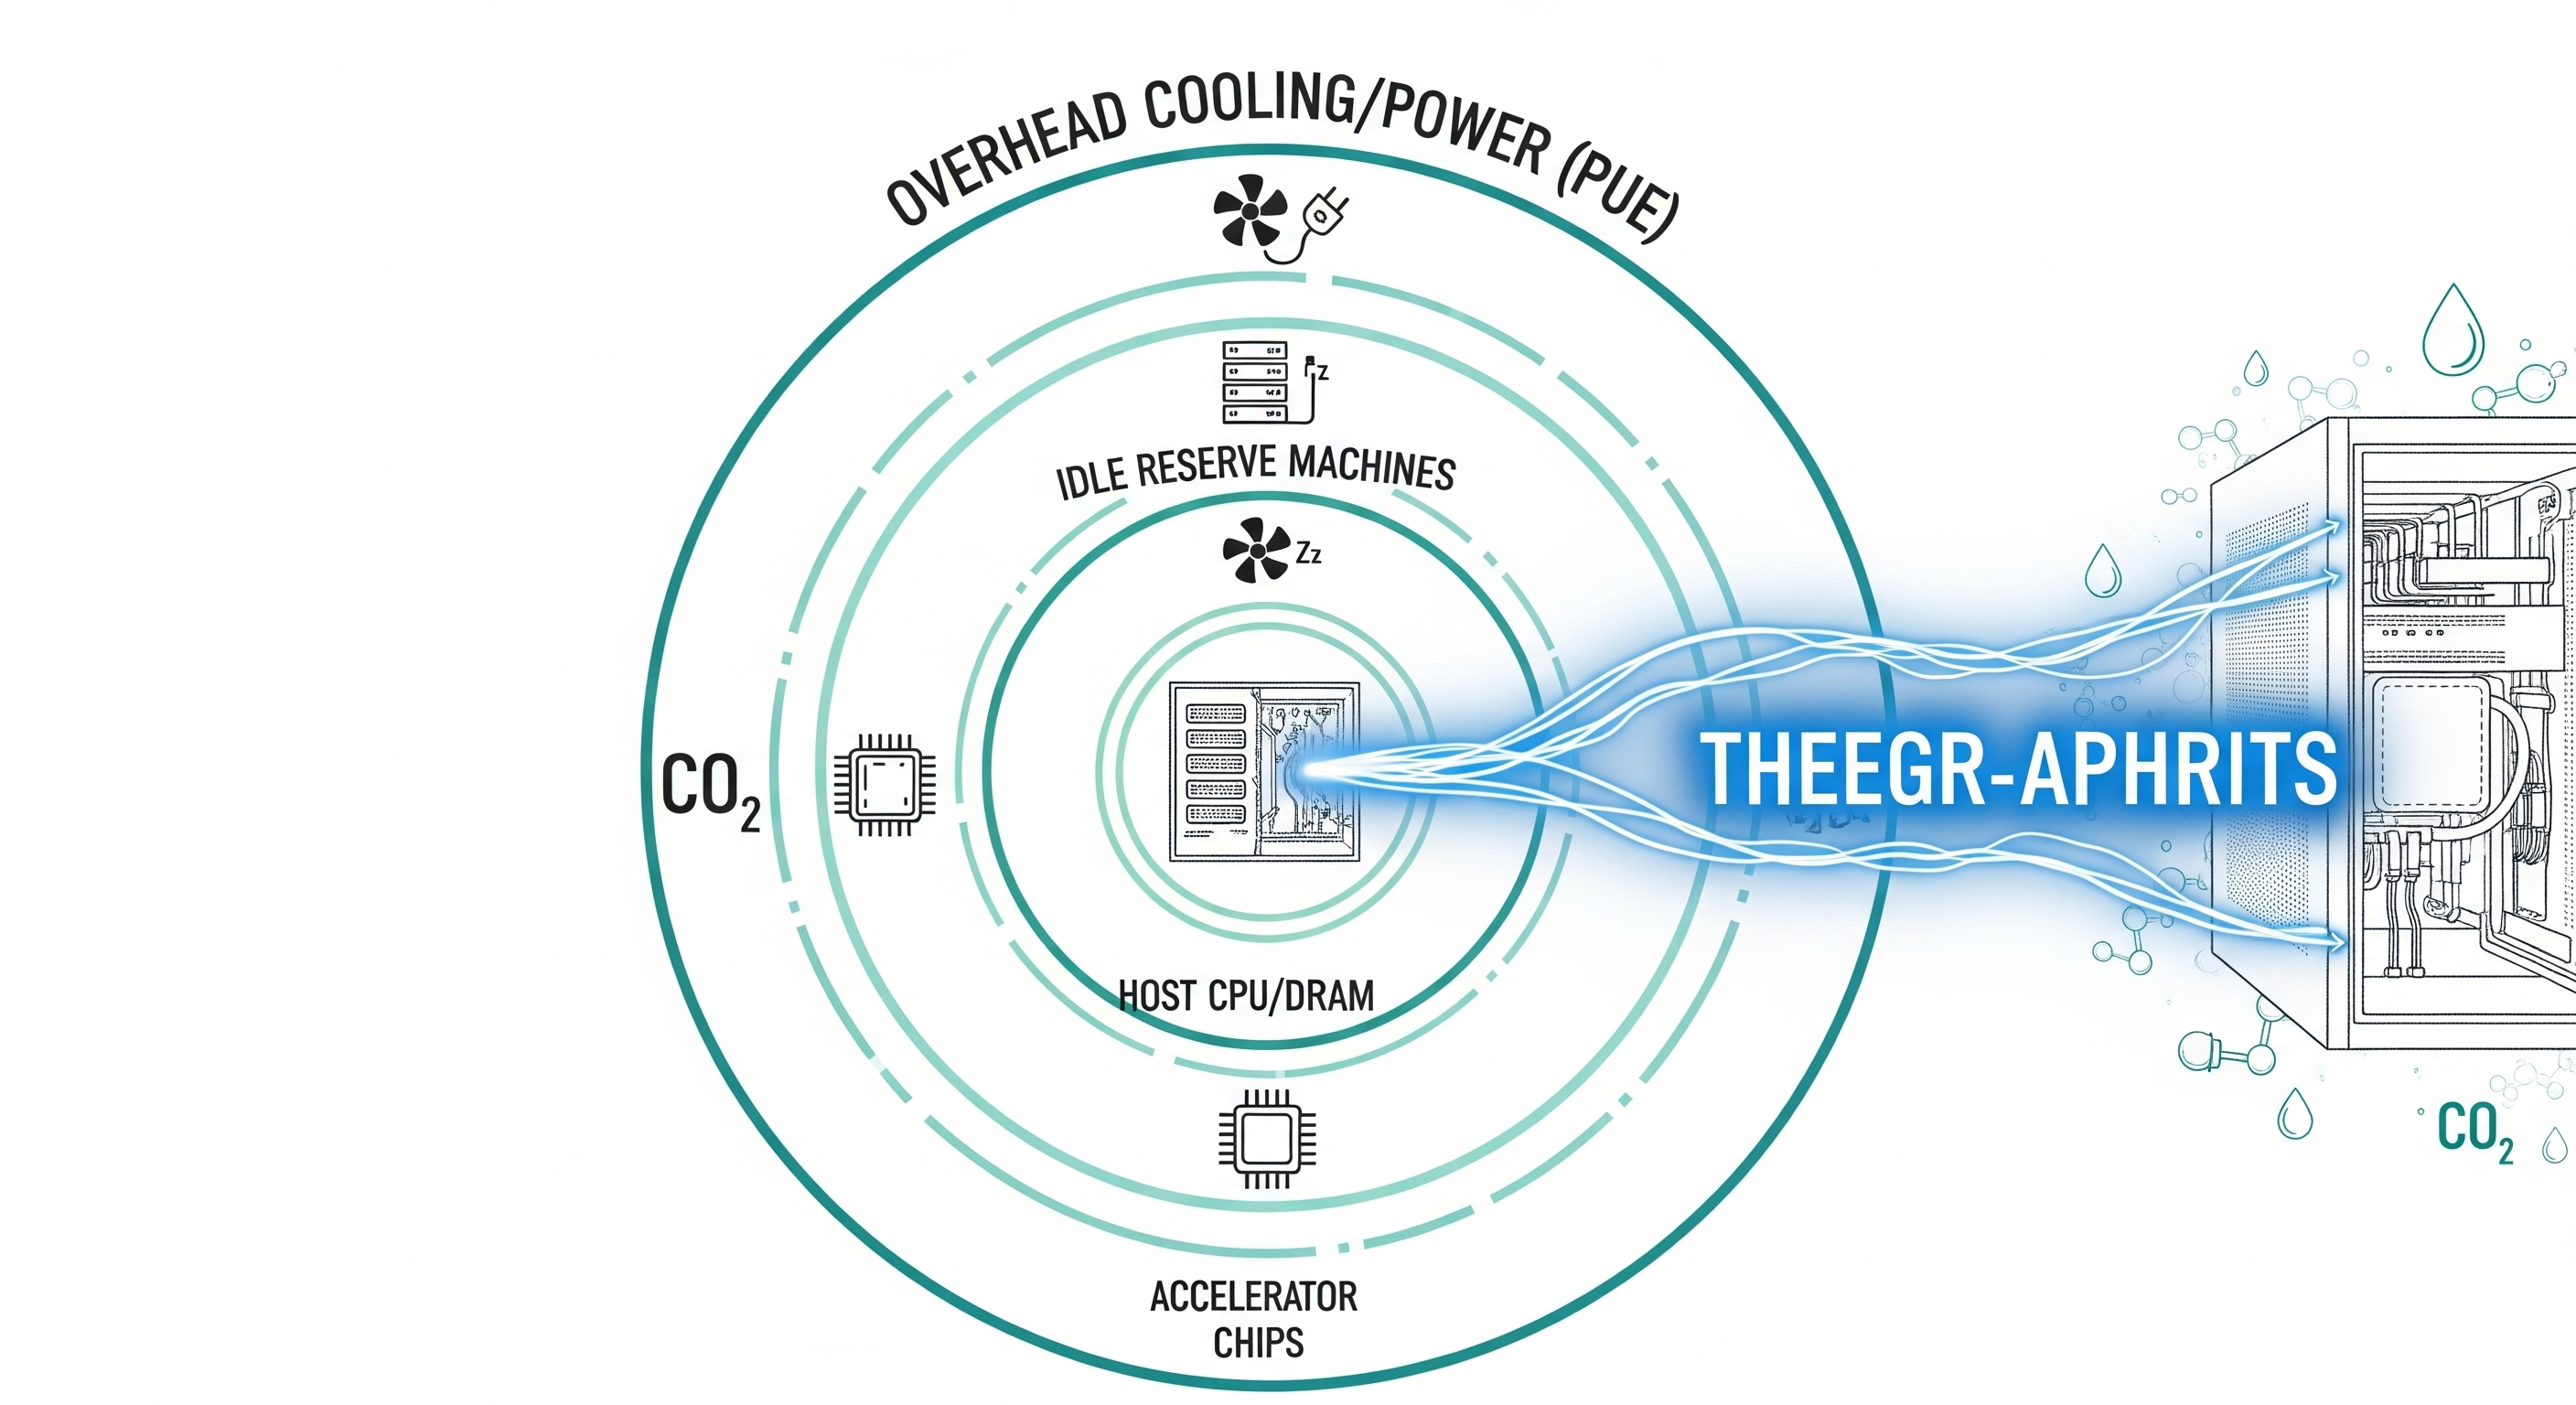
- Boundaries matter more than math. When you count only accelerator draw, you get ~0.10 Wh. Add host CPU/DRAM, idle reserve capacity, and data‑center overhead (PUE), and it rises to ~0.24 Wh. Same workload, different boundaries.
- Efficiency compounds across the stack. In one year, Google reports ~33× lower energy/prompt and ~44× lower emissions/prompt, driven by model/inference software, fleet utilization, cleaner power, and hardware generations.
- Action for buyers: Ask vendors to disclose measurement boundary, batching policy, TTM PUE/WUE, and market‑based emissions factors. Without these, numbers aren’t comparable.
Why the world argued about “energy per prompt”
Most public figures were estimates based on assumed GPUs, token lengths, and workloads. Real fleets don’t behave like lab benches. The biggest source of disagreement wasn’t arithmetic; it was the measurement boundary:
- Narrow boundary: Only active accelerator watts during inference (what many benchmarks measure).
- Comprehensive boundary: Add host CPU/DRAM, idle capacity provisioned for latency/reliability, and data‑center overhead via PUE.
Different boundaries produce order‑of‑magnitude swings and made past comparisons noisy and often unfair.
What Google actually measured (Gemini Apps, May 2025)
A fleet‑level, in‑situ telemetry methodology across the serving stack, then normalized per prompt using the daily median (robust to outliers like very long prompts or low‑utilization tails).
Side‑by‑side: Narrow vs Comprehensive
| Metric (median text prompt) | Existing/Narrow | Comprehensive |
|---|---|---|
| Energy (Wh/prompt) | 0.10 | 0.24 |
| • Active AI accelerators | 0.10 | 0.14 |
| • Host CPU & DRAM | — | 0.06 |
| • Idle machines (reserve) | — | 0.02 |
| • Data‑center overhead (PUE) | — | 0.02 |
| Emissions (gCO2e/prompt) | 0.02 | 0.03 |
| • Scope 2 (market‑based) | 0.016 | 0.023 |
| • Scope 1 + 3 (embodied) | 0.007 | 0.010 |
| Water (mL/prompt) | 0.12 | 0.26 |
Interpretation: If you only see “accelerator watts,” scale it up by ~1.7× to approximate real‑world serving under similar conditions. (Exact factor will vary by provider and site mix.)
What actually moved the needle (and will for you)
Efficiency gains came from multiple layers—the same levers enterprise buyers should push their vendors on:
-
Model architecture/serving strategy
- MoE & hybrid reasoning: Activate only the experts needed.
- Speculative decoding: Cheap draft model proposes tokens; big model verifies—skipping full‑fat steps when predictions are right.
- KV caching & disaggregated serving: Prefill and decode tuned separately; fewer redundant ops.
-
Software/compiler stack
- XLA/Pallas/Pathways‑style kernel & graph optimizations, quantization (e.g., AQT), distillation into Flash/Flash‑Lite‑class models for high‑throughput serving.
-
Fleet utilization & idling
- Bigger effective batch sizes at scale without breaking latency SLOs; dynamic model placement to curb idle waste.
-
Hardware & facilities
- New accelerator generations with higher perf/W; data centers at fleet PUE ~1.09 and water programs targeting WUE ~1.15 L/kWh average (with air‑cooling in high‑stress watersheds).
-
Procurement & siting
- More carbon‑free energy in the local grid mix (market‑based accounting) reduces gCO2e/kWh even as compute grows.
Result: Reported year‑over‑year reductions of ~33× energy/prompt and ~44× emissions/prompt for the median text prompt.
A buyer’s checklist for apples‑to‑apples comparisons
When an AI vendor quotes “Wh per prompt,” ask for these alongside the number:
-
Measurement boundary
- Include host CPU/DRAM, idle reserve, and PUE?
- Is the figure median or mean? Which workloads (text vs multimodal)?
-
Serving policy
- Batching constraints? Target latency SLOs? Speculative decoding enabled? KV cache hit rates?
-
Facility factors
- TTM PUE and WUE (Category 2) for the serving fleet used; seasonal/site normalization method.
-
Emissions methodology
- Market‑based Scope 2 factors and vintage; treatment of Scope 1 & 3 (embodied); location mix.
-
Workload envelope
- Input/output token distributions; safety/classifier/reranker calls included; median vs p90.
If suppliers cannot fill this table, the headline number is not decision‑grade.
Quick‑and‑dirty conversion crib (for planning)
- Energy → cost: 0.24 Wh/prompt @ $0.12/kWh ≈ $0.000000288/prompt (energy cost is negligible; infra & depreciation dominate TCO).
- Energy → water: Water ≈ (Energy − Overhead) × WUE. With WUE ≈ 1.15 L/kWh, 0.22 Wh ≈ 0.25 mL.
- Energy → emissions (MB): Energy × MB EF. Example: 0.24 Wh × 94 gCO2e/kWh ≈ 0.023 g (plus embodied ≈ 0.010 g).
These are order‑of‑magnitude guides; use your vendor’s disclosed PUE/WUE/MB factors.
A note on medians, not means
The median better represents a “typical” user prompt in skewed distributions (long prompts and low‑utilization tails distort the mean). For internal dashboards, track median, p90, and long‑tail outliers separately. Optimize p50 for cost; cap p90/p99 for SLOs and sustainability guardrails.
Where the debate goes next
- Standardized boundary: We need an industry norm that matches the comprehensive approach so buyers can compare providers.
- Modality drift: Multimodal prompts (audio/image/video) will raise energy/prompt—disclose per‑modality medians.
- Embodied emissions allocation: Method choices (time‑based vs usage‑based) matter; publish both where possible.
- Site transparency: Buyers should see regional factors (grid mix, water stress) and routing policies.
Bottom line for operators
If you’re running or buying AI at scale, the sustainability lever is not a single trick. It’s stacked: model choice → inference policy → fleet utilization → facility mix → procurement. Treat “Wh per prompt” as a system KPI, not a model factoid.
Cognaptus: Automate the Present, Incubate the Future