
In a field where LSTMs, transformers, and black-box agents often dominate the conversation, a new framework dares to ask: What if our old tools weren’t wrong, just under-optimized? That’s the central premise behind Technical Indicator Networks (TINs) — a novel architecture that transforms traditional technical analysis indicators into interpretable, trainable neural networks.
Indicators, Meet Neural Networks
Rather than discarding hand-crafted indicators like MACD or RSI, the TIN approach recasts them as neural network topologies. A Moving Average becomes a linear layer. MACD? A cascade of two EMAs with a subtractive node and a smoothing layer. RSI? A bias-regularized division circuit. The resulting neural networks aren’t generic function approximators; they’re directly derived from the mathematical structure of the indicators themselves.
This isn’t metaphorical. Here’s a simplified comparison:
| Classic Indicator | TIN Topology | Key Neural Operation |
|---|---|---|
| SMA / EMA | Linear layer (fixed weights) | Moving average logic |
| MACD | Dual linear layers + subtraction + smoothing | Signal oscillator |
| RSI | Bias-regularized division | Momentum normalization |
| CCI | Mean + MAD + normalized division | Volatility-scaling |
| Stochastic Oscillator | Adaptive min/max pooling | Price range detection |
Each of these is implemented as a small interpretable neural network — a so-called Indicator Network (IN) — that can be trained or left fixed.
From Static Rules to Adaptive Systems
Traditional technical indicators rely on predefined parameters (e.g. MACD(12,26,9)) that rarely generalize well across assets or market regimes. TINs offer a two-step innovation:
- Initialization with classical logic: Set the initial weights to match original formulas.
- Dynamic fine-tuning via RL: Use Deep Q-Learning or PPO to optimize these weights over time in a simulated trading environment.
The result: indicators that remain interpretable, yet can adapt their lookback periods, smoothing rates, or weighting schemes in response to market dynamics.
Multi-Input, Multi-Asset, Multi-Purpose
One of the most powerful extensions of TINs is their ability to scale beyond single-price inputs. A MACD TIN can ingest not just price but also volume indicators (e.g., OBV), sentiment scores from news, or even policy event signals parsed by a large language model.
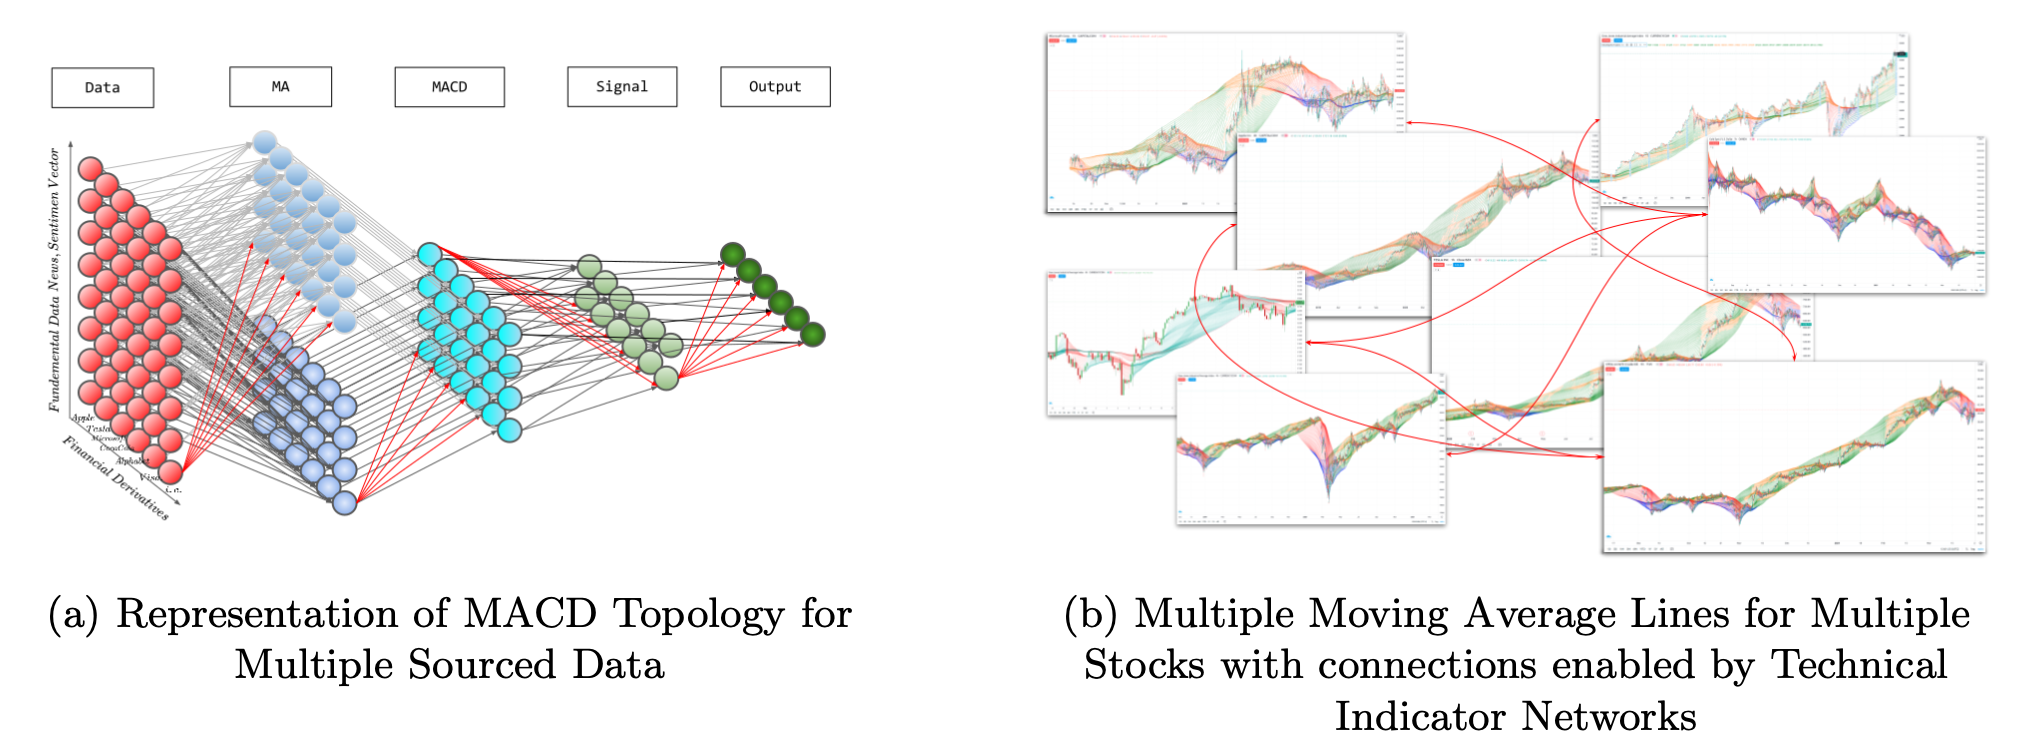
This transforms the TIN from a simple charting tool into a modular analytical engine that supports multi-stock, multi-factor decision-making. In a backtest using 30 components of the US30 index, the TIN outperformed the classic MACD in Sharpe ratio (2.74 vs. 1.64) and Sortino ratio (3.99 vs. 1.85), despite making roughly the same number of trades.
Bridging the Gap to LLMs
Perhaps the most forward-looking aspect of TINs is their compatibility with Large Language Models. While LLMs can extract structured data from unstructured text (e.g., headlines, policy changes), TINs can ingest these signals as auxiliary inputs, maintaining the interpretability of the trading strategy.
This opens the door to multi-agent systems, where one agent parses news, another updates sentiment vectors, and a third — the TIN itself — executes trades based on a hybrid of classical logic and real-time signals. All within a framework that remains explainable to both regulators and human traders.
A New Design Philosophy
TINs don’t try to reinvent trading from scratch. They build on the decades of domain expertise embedded in technical indicators and give them a new life within modern AI systems. For firms with legacy rule-based systems, TINs offer a low-friction path to modernization.
Just as convolutional layers transformed pixel data in vision tasks, Indicator Networks may become the financial equivalent: domain-native building blocks for interpretable, adaptable, AI-driven trading systems.
Cognaptus: Automate the Present, Incubate the Future.