TL;DR for operators
Offshore infrastructure is hard to monitor because the ocean is large, reporting is uneven, and many installations are either poorly documented or wrapped in the usual fog of commercial and national sensitivity. Sentinel-1 radar imagery helps because it works through clouds and darkness. Deep learning helps because it can scan more scenes than any analyst team pretending it enjoys repetitive labour.
The paper behind this article shows something more specific: synthetic data improves offshore platform detection when it is used as a balancing instrument, not as a fantasy replacement for real-world labels. The researchers trained YOLOv10 models on Sentinel-1 SAR imagery from four regions, then tested them on three unseen regions. Adding synthetic training examples raised the unified platform F1 score from 0.85 to 0.90. Training only on synthetic data, however, collapsed to almost no useful recall. The machine, it turns out, still likes reality.
For business use, the result points toward a practical operating model: use real satellite labels as the anchor, generate synthetic samples for rare or underrepresented infrastructure forms, validate on genuinely unseen geographies, and publish outputs as geospatial inventory layers rather than glossy “AI insight” dashboards. The ROI is not magic automation. It is lower marginal monitoring cost, better class coverage, and faster updating of infrastructure inventories across politically and commercially awkward waters.
The boundary is just as important. Sentinel-1’s roughly 10-metre spatial resolution limits very small platform detection. Radar-bright objects such as buoys, reefs, lighthouses, and unfinished wind turbine foundations can still confuse the model. Synthetic data can reduce imbalance, but it cannot certify truth. Annoying, yes. Also useful.
The ocean has a spreadsheet problem
Start with a familiar business irritation: asset registers are rarely complete. Someone has a database. Someone else has a map. A regulator has filings. An operator has internal records. A consultant has a PDF. Then everyone meets and calls this “situational awareness”, because “fragmented clerical archaeology” does not fit neatly on a slide.
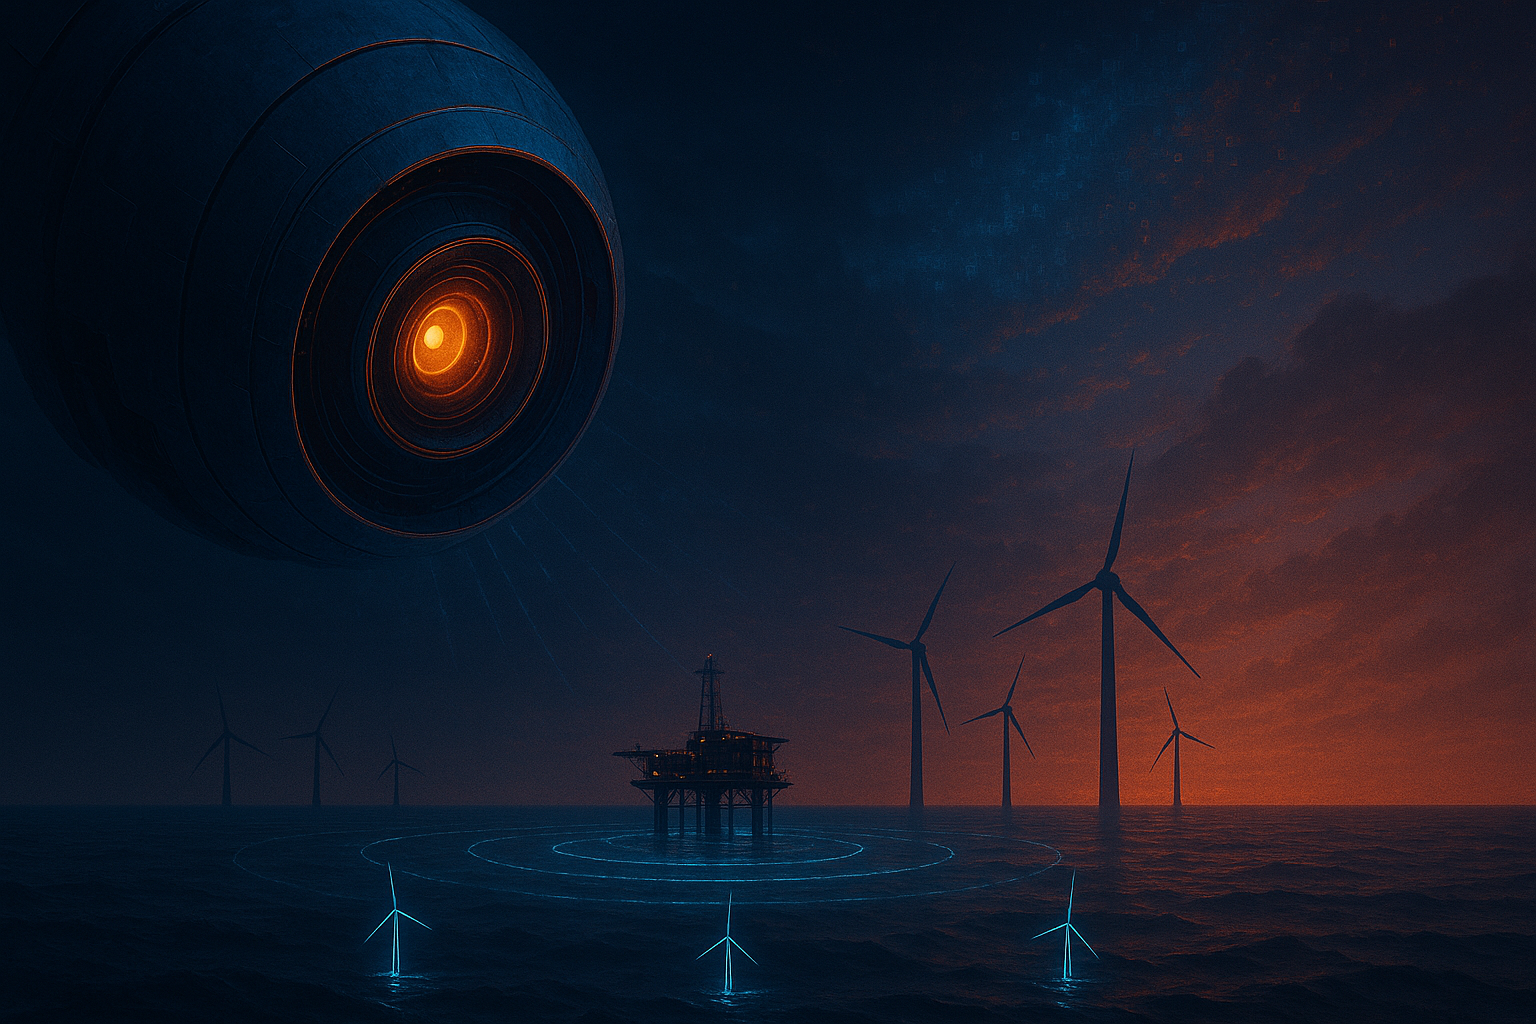
At sea, the problem becomes worse. Offshore platforms, wind farms, artificial islands, aquaculture sites, and related infrastructure sit across vast areas that are expensive to inspect directly. Some facilities are well documented. Others are reported inconsistently, appear in restricted datasets, or change faster than official inventories admit. The result is a monitoring gap: the objects are physically large, economically important, and still surprisingly slippery in data terms.
Satellite imagery offers the obvious escape route. Synthetic aperture radar, especially Sentinel-1, is useful because it can image the Earth day and night and in all weather conditions.1 Metallic offshore structures stand out against the darker sea surface because of strong radar backscatter. The ocean is not hiding from the sensor. The difficulty is teaching a model to interpret what it sees at scale.
That is where the paper by Robin Spanier, Thorsten Hoeser, and Claudia Kuenzer matters. Their study, “Deep learning-based object detection of offshore platforms on Sentinel-1 Imagery and the impact of synthetic training data,” trains YOLOv10 object detectors on real and synthetic Sentinel-1 imagery to detect offshore platforms across regions.2 The useful contribution is not merely “AI finds oil rigs”. We have seen that movie. The better claim is narrower and more operational: synthetic examples can help a detector generalise across oceans when the real training set is structurally imbalanced.
The bottleneck is not image volume; it is labelled variety
Earth observation does not suffer from a shortage of pixels. The modern satellite archive is a warehouse in which the shelves keep multiplying. The paper uses Sentinel-1 scenes from the fourth quarter of 2023, processed into median composites and tiled for detection. Across the study regions, the authors generated 928 median-composite tiles from 3,511 Sentinel-1 scenes.
The real scarcity is not raw imagery. It is labelled examples of the right kind.
Offshore platforms do not appear in one clean visual category. A single platform can be compact. A complex can include several connected structures. Wind turbines can appear nearby and may need to be separated from substations or platform-like objects. SAR adds its own pleasant complications: a structure’s radar signature can be larger than its physical footprint because of layover, double reflections, and other backscatter effects. In polite terms, SAR imagery is information-rich. In less polite terms, it makes metal behave like it has hired a lighting designer.
The authors label three classes: single platforms, platform clusters, and wind turbines as an off-target class. Their full ground-truth dataset contains more than 14,000 polygons across seven regions. But the imbalance is severe. In the training regions, there are only 271 platform-cluster labels, compared with 2,330 single-platform labels and 2,920 wind-turbine labels after splitting the platform classes.
That imbalance is the paper’s central practical problem. If the model rarely sees platform clusters during training, it will not learn them well. If the business problem involves dense offshore fields and complex infrastructure groups, ignoring that minority class is not a harmless statistical footnote. It is the part of the system that fails exactly where the monitoring problem becomes interesting.
Synthetic data works here because it changes the class distribution
The study uses SyntEO, a synthetic Earth observation data generation framework, to create additional image-label pairs.3 SyntEO is not a generic “make me a satellite picture” toy. It is designed for Earth observation, combining expert knowledge and procedural scene generation so researchers can create controlled training examples for remote-sensing tasks.
The authors test five dataset configurations:
| Training setup | What it tests | Operational interpretation |
|---|---|---|
| Base | Single platforms and clusters treated as one platform class | A simple detector can work, but it hides cluster weakness |
| Split | Single platforms and clusters trained separately | Separating classes reveals where the model struggles |
| Cluster-enriched | Synthetic samples added mainly for platform clusters | Synthetic data acts as minority-class support |
| Fully balanced | Synthetic samples added across all classes to reach 5,000 per class | Synthetic data becomes a class-balancing strategy |
| Synthetic-only | Model trained only on synthetic examples | Tests whether simulation can replace reality |
This table is the argument in miniature. Synthetic data is not being used as decorative volume. It is being used to repair the training distribution.
The cluster-enriched version adds more than 2,000 synthetic platform-cluster samples. The fully balanced version expands each class to 5,000 samples. This is the sensible part: if real-world samples are scarce, expensive, or geographically limited, synthetic generation can fill specific holes in the training set.
The less sensible version would be to flood the model with synthetic scenes and declare the data problem solved. The authors test that too. It fails.
The performance gain is real, but the synthetic-only result is the warning label
The strongest result is straightforward. A split model using YOLOv10s reaches an F1 score of 0.85 for the unified platform class. Adding synthetic data for the cluster-enriched dataset improves the unified platform result to an F1 score of 0.88. The fully balanced dataset reaches precision 0.91, recall 0.89, and F1 0.90.
The platform-cluster class shows why this matters. Before synthetic enrichment, platform-cluster F1 is below 0.48 in the relevant split experiments. With cluster enrichment, platform-cluster precision rises from 0.46 to 0.79 and F1 rises from 0.48 to 0.65. That is not just a prettier benchmark. It means the model becomes less confused by the complicated, crowded offshore configurations that simple datasets tend to underrepresent.
Then comes the useful slap in the face: synthetic-only training performs almost uselessly. The model trained exclusively on 5,000 synthetic samples per class reaches a unified platform F1 of about 0.01. It essentially cannot transfer the synthetic features to real Sentinel-1 imagery.
So the lesson is not “fake data is good”. The lesson is “synthetic data is useful when it is tethered to real data and aimed at a known distributional weakness”. A less catchy slogan, admittedly. Also less likely to bankrupt the project.
| Claim | Paper evidence | Business meaning | Boundary |
|---|---|---|---|
| Synthetic data improves detection when mixed with real data | Unified platform F1 rises to 0.90 with the fully balanced dataset | Synthetic augmentation can raise operational recall and precision without collecting every rare example manually | The gain depends on a real labelled anchor |
| Minority-class support is the main mechanism | Platform-cluster F1 improves from 0.48 to 0.65 after synthetic enrichment | Use synthetic data where the dataset is thin, not everywhere by reflex | Synthetic samples must resemble the sensor physics and target geometry |
| Synthetic-only training is not enough | Synthetic-only model produces near-zero real-world recall | Simulation is not a substitute for field evidence | Domain gap remains decisive |
| Geographic holdout matters | Training uses South China Sea, Caspian Sea, Gulf of Guinea, and Coast of Brazil; testing uses North Sea, Gulf of Mexico, and Persian Gulf | A region-holdout test is closer to deployment reality than random train-test splitting | It still covers selected regions, not the whole ocean |
The geography test is the part operators should actually care about
Random train-test splits are comfortable. They are also a wonderful way to fool oneself. If neighbouring image chips or similar regional patterns leak across splits, a model can look clever while mostly recognising familiar geography in a slightly different hat.
This paper avoids that trap by using a region-holdout design. Training data comes from the South China Sea, Caspian Sea, Gulf of Guinea, and Coast of Brazil. Testing happens in the North Sea, Gulf of Mexico, and Persian Gulf. That matters because the business question is not whether the detector can rediscover platforms near where it learned. The question is whether it can travel.
The fully balanced model detects 3,529 offshore platforms in the three unseen regions: 411 in the North Sea, 1,519 in the Gulf of Mexico, and 1,593 in the Persian Gulf. Region-level recall varies from 0.83 in the North Sea to 0.93 in the Persian Gulf. Across the evaluation set, the model correctly identifies 3,523 of 3,960 platforms, with 422 false negatives and 312 false positives.
That is strong enough to matter. It is not a complete industrial truth engine, because no such thing exists and vendors should stop pretending otherwise. But it is a credible foundation for scalable monitoring: generate candidate inventories, flag changes, prioritise analyst review, and compare infrastructure growth or decommissioning over time.
The result also fits a wider trend in ocean monitoring. Paolo et al. used large-scale satellite analysis to map industrial activity at sea and showed that a substantial share of vessel activity is missing from public tracking systems.4 Earlier work by Wong, Thomas, and Halpin used SAR and Google Earth Engine to automate offshore infrastructure extraction in the Gulf of Mexico.5 DeepOWT showed that deep learning on Sentinel-1 can support global offshore wind turbine datasets.6 The Spanier-Hoeser-Kuenzer paper extends this lineage by focusing on offshore platforms and by testing how synthetic data affects transferability.
The operational pipeline is boring in exactly the right way
One underrated strength of the study is its deployment-minded pipeline. The authors preprocess Sentinel-1 imagery into median composites, tile it into 640-by-640-pixel chips, train YOLOv10 models, deploy inference on Google Cloud Platform via Vertex AI, export prediction metadata, and postprocess detections into geospatial outputs.
This is not glamorous. Good. Glamour is often where Earth observation projects go to die.
The median composite step helps remove transient objects such as ships before inference. The model outputs bounding boxes and classes. Postprocessing reprojects detections, filters weak predictions, removes low-backscatter noise, groups duplicates caused by tile overlap, and exports cleaned detections as GeoJSON.
For an operator, that means the output can become a GIS layer, not just a model score. That is the difference between a research demo and something a regulator, insurer, energy analyst, environmental monitor, or maritime security team can actually use.
The business value sits in three places:
- Inventory refresh: offshore platform databases can be checked against independent satellite-derived detections.
- Change monitoring: repeated quarterly or annual runs can flag additions, removals, or relocations.
- Review prioritisation: analysts can inspect uncertain detections rather than manually searching entire coastlines.
None of this eliminates human review. It changes where human review is spent. That is usually where automation first becomes economically serious.
The misconception: synthetic data is not a cheaper universe
The tempting interpretation is that synthetic data makes expensive labelling obsolete. That is the sort of sentence that sounds strategic at conferences and expensive during implementation.
The paper says something sharper. Synthetic data is useful because it lets teams deliberately reshape the training distribution. It can create more examples of rare platform clusters. It can balance classes. It can expose the model to structural configurations it might otherwise see too rarely. But it does not provide all the sensor-specific messiness of real SAR imagery.
This distinction matters because remote sensing models fail in ways that are not obvious from clean demos. SAR backscatter depends on geometry, material, sea state, incidence angle, preprocessing, and surrounding clutter. A synthetic scene may capture the label geometry while missing the texture physics. The synthetic-only model’s near-zero transfer is the receipt.
For Cognaptus clients and similar operators, the practical rule is simple: treat synthetic data as a controlled supplement to real observations. Use it to answer a specific question: “Which class, region, object shape, or sensor condition is underrepresented?” If that question cannot be answered, the synthetic-data plan is probably just dataset inflation wearing a lab coat.
What this directly shows, what Cognaptus infers, and what remains uncertain
The paper directly shows that a YOLOv10 detector trained on Sentinel-1 imagery can identify offshore platforms in unseen regions with strong performance, and that adding synthetic data improves results when used to balance underrepresented classes. It also directly shows that synthetic-only training fails to generalise to real Sentinel-1 images in this setup.
Cognaptus infers that the near-term business case is not “fully automated ocean truth”. It is “lower-cost, repeatable infrastructure intelligence with analyst-in-the-loop validation”. The method is especially relevant where official inventories are incomplete, outdated, restricted, or inconsistent across jurisdictions. Offshore energy, marine spatial planning, environmental compliance, insurance exposure, and security monitoring are the obvious beneficiaries.
What remains uncertain is the global scaling behaviour. The test regions are important and diverse, but they are not the entire maritime world. The model’s performance on smaller platforms, unusual structures, dense coastal clutter, non-energy infrastructure, aquaculture sites, and regions with different SAR acquisition patterns still needs systematic testing. Also, any production-grade version would need temporal validation: detecting a platform once is useful; tracking installation, decommissioning, maintenance, and relocation over time is where the operational value compounds.
Boundaries that affect deployment
The first boundary is spatial resolution. Sentinel-1’s roughly 10-metre resolution is powerful for broad monitoring, but very small structures can approach or fall below the effective pixel scale. The paper notes false negatives for small platforms, especially in the Gulf of Mexico. A model cannot reliably identify what the sensor barely resolves. AI remains disappointingly obedient to physics.
The second boundary is class ambiguity. Buoys, lighthouses, reefs, and unfinished turbine foundations can produce radar signatures that resemble platforms. The model handles wind turbines well overall, with an off-target wind-turbine F1 score of 0.97, but construction-stage ambiguity remains a practical nuisance. Adding more off-target classes could help, but that again requires reference data, synthetic support, or both.
The third boundary is synthetic texture quality. The authors suspect that SyntEO-generated textures are a bottleneck. More nuanced simulation of backscatter, noise, and radar texture could improve synthetic-to-real transfer. Generative methods that learn texture representations may help, but they will still need validation against real SAR scenes.
The fourth boundary is governance. Satellite-derived infrastructure maps can influence regulation, investment, environmental claims, and geopolitical interpretation. A false positive in a dashboard is not merely a technical error if someone uses it to make a compliance decision. The workflow therefore needs provenance: source imagery, model version, confidence thresholds, postprocessing rules, review status, and update cadence.
The real value is monitored reality, not synthetic theatre
The paper’s quiet achievement is that it avoids the usual synthetic-data melodrama. It does not prove that simulation replaces reality. It proves that simulation can make reality more learnable.
That is the right framing for business. Real-world labels remain the anchor. Synthetic examples supply coverage where reality is sparse. Region-holdout validation checks whether the model can travel. Postprocessing turns detections into geospatial assets. The resulting system is less a magic eye in the sky than a disciplined inventory engine—less cinematic, more useful, and therefore at risk of being underappreciated.
For offshore infrastructure, that is enough. The ocean does not need another dashboard that glows convincingly. It needs better records of what is actually there, where it is changing, and which claims deserve inspection. Synthetic seas can help train real eyes in space, provided we remember which part is synthetic and which part is supposed to be true.
Cognaptus: Automate the Present, Incubate the Future.
-
Copernicus Data Space Ecosystem, “Sentinel-1,” describing Sentinel-1 as a C-band SAR mission operating day and night and in all weather conditions: https://dataspace.copernicus.eu/data-collections/copernicus-sentinel-missions/sentinel-1. ↩︎
-
Robin Spanier, Thorsten Hoeser, and Claudia Kuenzer, “Deep learning-based object detection of offshore platforms on Sentinel-1 Imagery and the impact of synthetic training data,” arXiv:2511.04304, 2025: https://arxiv.org/abs/2511.04304. ↩︎
-
Thorsten Hoeser and Claudia Kuenzer, “SyntEO: Synthetic Data Set Generation for Earth Observation and Deep Learning — Demonstrated for Offshore Wind Farm Detection,” arXiv:2112.02829, 2021; later published in ISPRS Journal of Photogrammetry and Remote Sensing: https://arxiv.org/abs/2112.02829. ↩︎
-
Fernando S. Paolo et al., “Satellite mapping reveals extensive industrial activity at sea,” Nature 625, 85–91, 2024: https://www.nature.com/articles/s41586-023-06825-8. ↩︎
-
Benjamin A. Wong, Courtney Thomas, and Patrick Halpin, “Automating offshore infrastructure extractions using synthetic aperture radar & Google Earth Engine,” Remote Sensing of Environment 233, 111412, 2019: https://hero.epa.gov/reference/8669496/. ↩︎
-
Thorsten Hoeser, Simon Feuerstein, and Claudia Kuenzer, “DeepOWT: a global offshore wind turbine data set derived with deep learning from Sentinel-1 data,” Earth System Science Data 14, 4251–4270, 2022: https://essd.copernicus.org/articles/14/4251/2022/. ↩︎