TL;DR for operators
A Google paper on Gemini Apps reports that the median text prompt in May 2025 consumed 0.24 Wh, generated 0.03 gCO2e, and consumed 0.26 mL of water under a comprehensive production-serving measurement boundary.1 That is small. Very small. Less “boil the kettle” and more “squint at a television for nine seconds.”
But the useful part is not the cute comparison. The useful part is the accounting boundary.
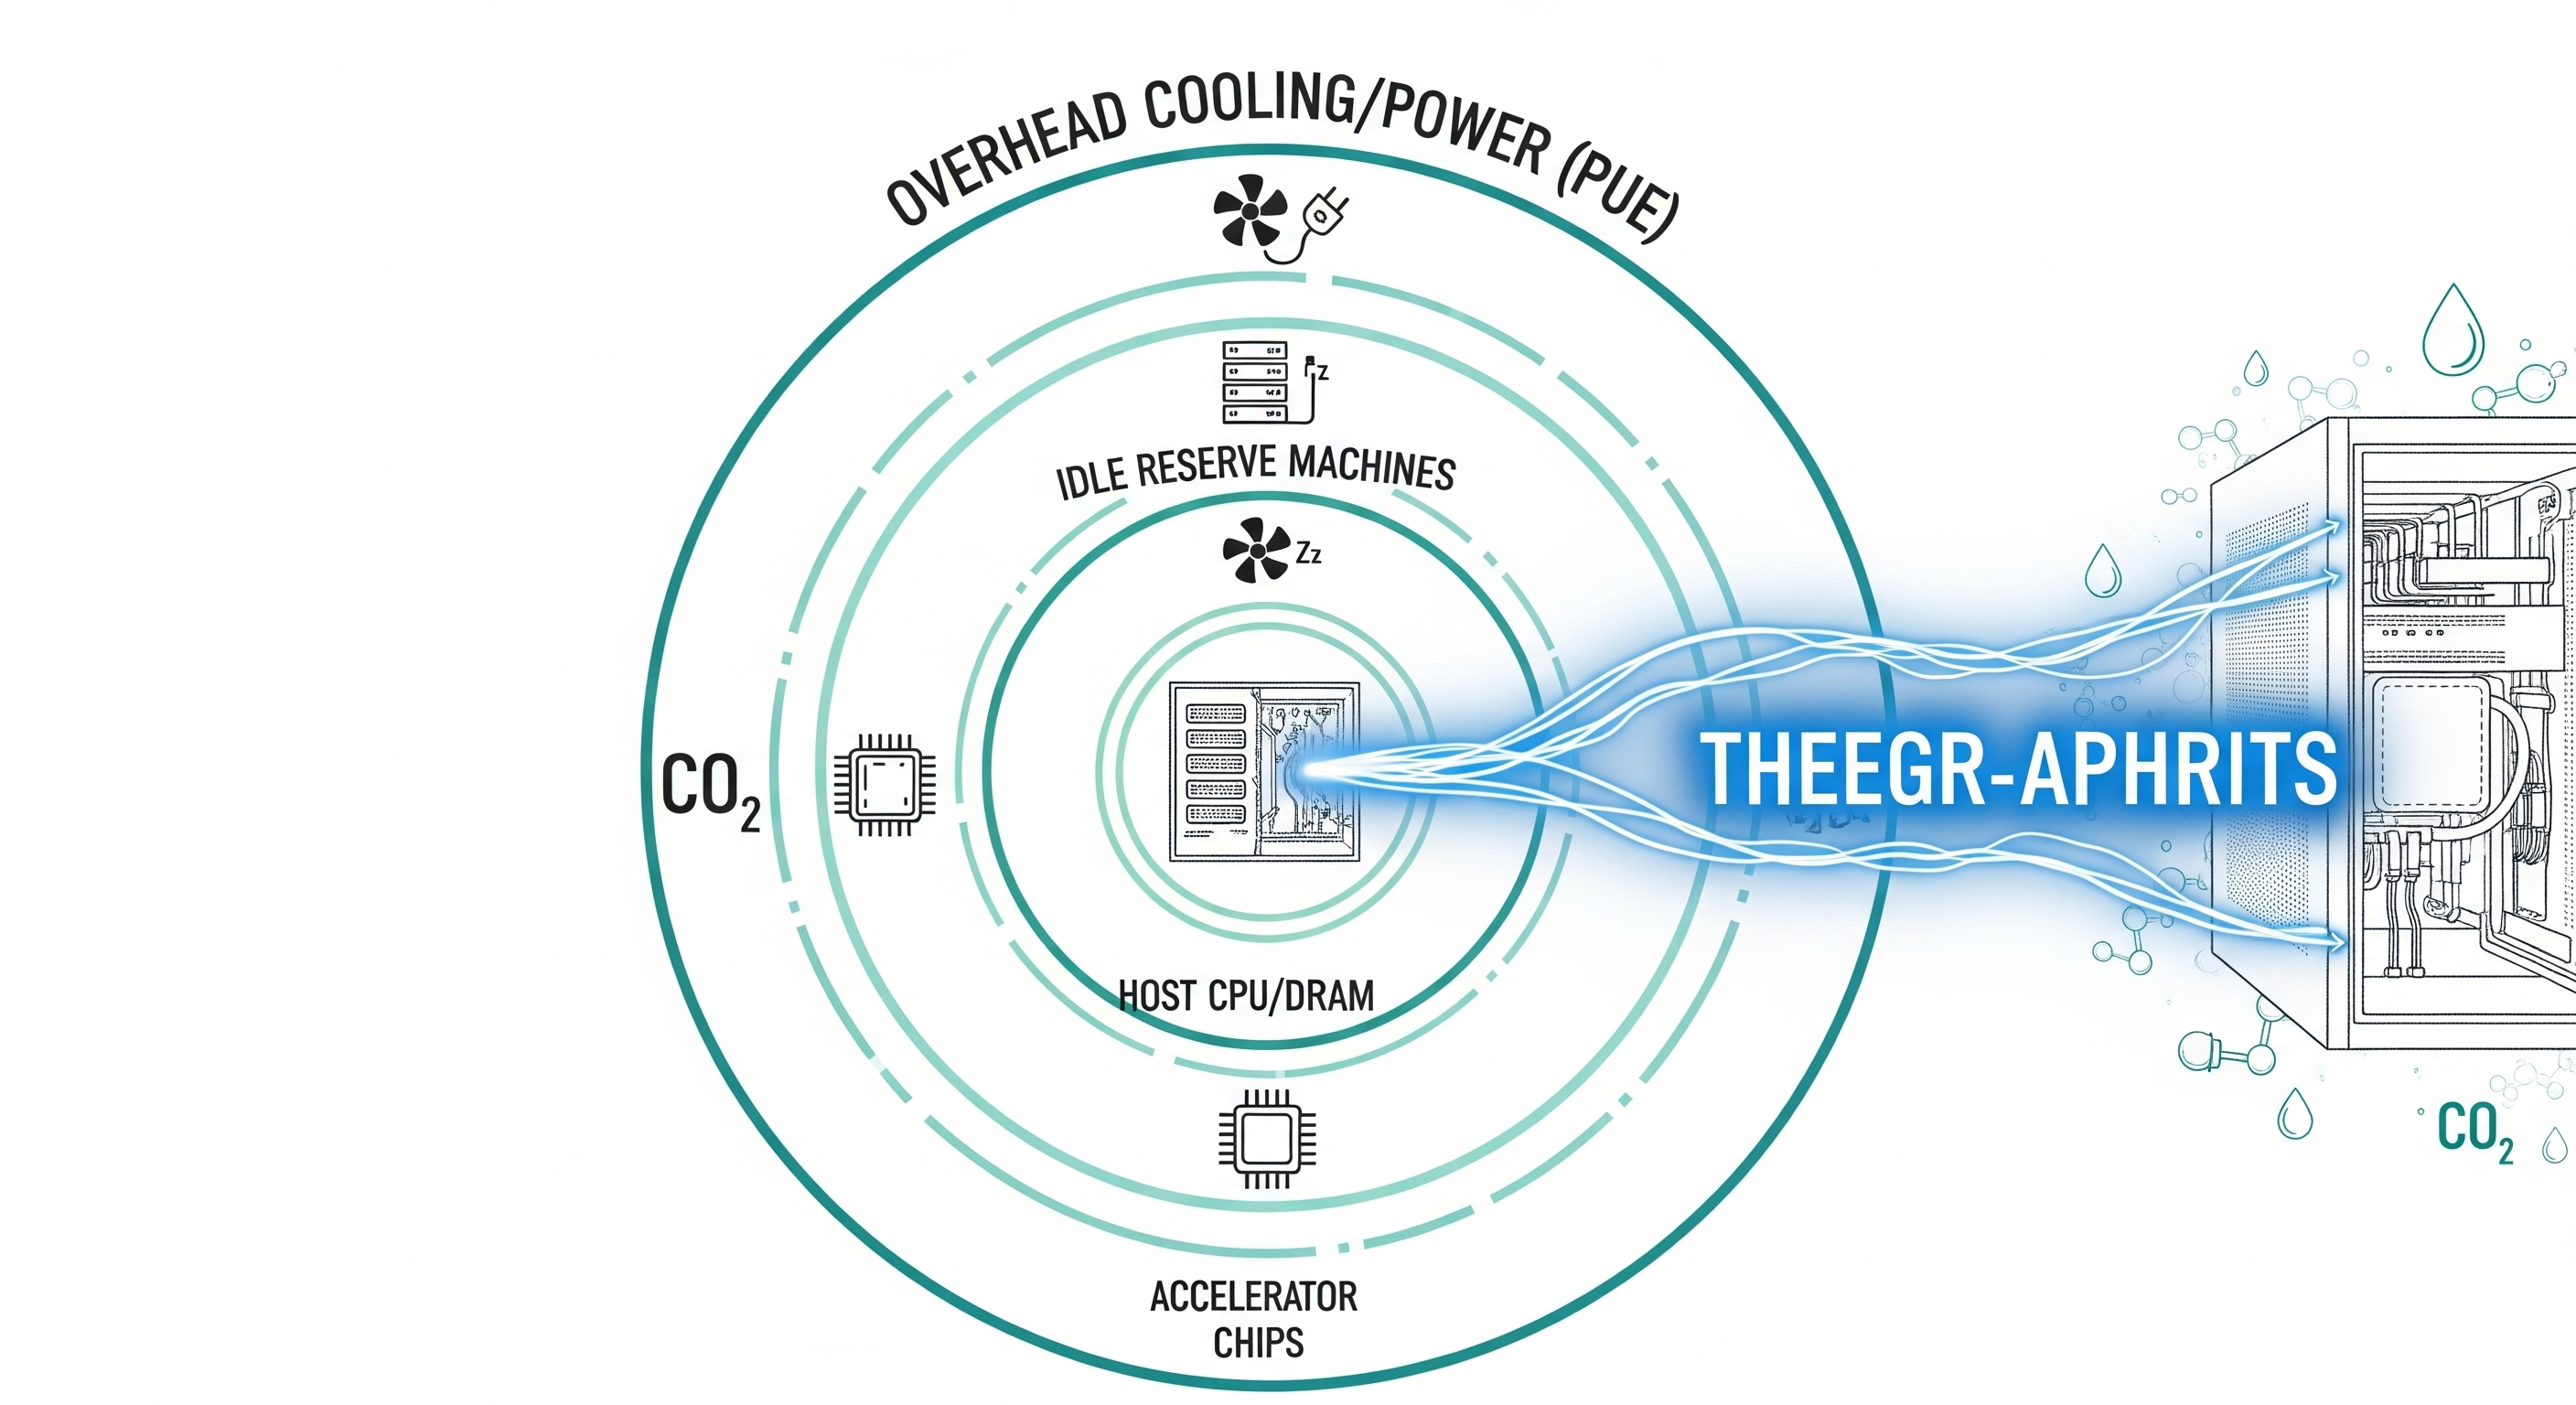
The paper says a real AI serving footprint should not count only the accelerator doing the model computation. It should also count the host CPU and DRAM, idle machines provisioned for reliability and latency, data-centre overhead through PUE, market-based electricity emissions, embodied hardware emissions, and cooling water consumption. In Google’s own comparison, the narrow accelerator-style view gives 0.10 Wh per prompt; the comprehensive production view gives 0.24 Wh. The denominator got wider. The headline stayed surprisingly low.
For business readers, the lesson is not “AI is free now, please stop asking questions.” It is: ask vendors what they counted. A per-prompt number without a measurement boundary is not transparency. It is a postcard from the accounting department.
The result applies most directly to median Gemini Apps text prompts served by Google infrastructure. It does not measure training, end-user devices, external networking, multimodal workloads, average or tail prompts, enterprise RAG pipelines, agentic tool chains, or another provider’s serving stack. That boundary is not a flaw. It is the whole point.
The prompt number is not the story; the boundary is
A modern AI prompt feels weightless. A few words go in, a paragraph comes out, and somewhere a data centre briefly impersonates a very expensive intern. The obvious question is: what did that cost?
The less obvious question is: what counts as “that”?
Google’s paper, Measuring the environmental impact of delivering AI at Google Scale, is best read as a boundary-setting exercise disguised as a per-prompt footprint study. The headline figures are memorable: a May 2025 median Gemini Apps text prompt uses 0.24 Wh, emits 0.03 gCO2e, and consumes 0.26 mL of water under the authors’ comprehensive method. The paper also reports a 33x reduction in energy per prompt and a 44x reduction in emissions per prompt over one year.
Those numbers will get quoted because numbers are convenient and context is annoying. But quoting only the numbers misses the paper’s actual contribution.
The work matters because the authors define a production-serving measurement boundary and then apply it to a live, large-scale AI assistant. They are not merely asking how much electricity an accelerator draws while generating tokens. They are asking what a deployed AI service consumes once the surrounding machinery is included: host systems, idle capacity, cooling and power overhead, electricity carbon intensity, embodied hardware emissions, and water.
That changes the conversation. It moves AI sustainability from “how hot did the GPU get?” to “what operating system of infrastructure made the answer possible?”
Congratulations. We have discovered accounting.
The narrow answer is 0.10 Wh; the production answer is 0.24 Wh
The paper contrasts two measurement approaches.
The narrower “existing” style approximates what many benchmark-oriented studies tend to capture: active AI accelerator energy, often under efficient or controlled conditions. In Google’s comparison, that gives 0.10 Wh per prompt for the median Gemini Apps text prompt.
The comprehensive production approach counts more of the serving stack. That gives 0.24 Wh per prompt.
| Measurement view | What it mostly represents | Reported energy for median Gemini Apps text prompt | What the number is useful for |
|---|---|---|---|
| Narrow existing-style approach | Active AI accelerator energy under a more benchmark-like efficient sample | 0.10 Wh | Comparing with accelerator-centric studies |
| Comprehensive production approach | Accelerator, host CPU/DRAM, idle capacity, and data-centre overhead | 0.24 Wh | Estimating real production-serving energy under Google’s boundary |
The difference is not a rounding error. The comprehensive number is 2.4x the narrow one.
That does not mean the larger number is “bad” and the smaller one is “fake.” They answer different questions. The narrow number asks something like: How much energy did the main compute device consume while doing inference? The comprehensive number asks: What energy did the production service need to make that prompt available with real latency, uptime, routing, and infrastructure overhead?
For operators, the second question is usually the more useful one.
Benchmarks can be clean because benchmarks do not need to wake up globally, absorb demand spikes, maintain failover capacity, route user traffic, or keep a product alive at consumer scale. Production systems do. That extra responsibility has an energy footprint.
What Google counts, and why each category matters
The comprehensive boundary has four main energy components.
| Component | May 2025 comprehensive value | Share of total | Why it matters operationally |
|---|---|---|---|
| Active AI accelerator energy | 0.14 Wh | 58% | The model computation itself: prefill, decode, and accelerator-side work |
| Active CPU and DRAM energy | 0.06 Wh | 25% | Host systems that support the accelerators and serving jobs |
| Idle machine energy | 0.02 Wh | 10% | Reserved capacity for reliability, latency, failover, and traffic variation |
| Data-centre overhead | 0.02 Wh | 8% | Cooling, power conversion, and other facility overhead captured through PUE |
| Total | 0.24 Wh | 100% | The comprehensive production-serving estimate |
The table is more important than the headline.
The accelerator still dominates. That is expected. But it is not the whole system. Host CPU and DRAM contribute a quarter of the total. Idle provisioned capacity and overhead are each small but material. A procurement team that asks only for “GPU energy per request” would miss part of the footprint. A vendor that reports only accelerator energy may not be lying. It may simply be answering the narrower, less useful question.
The idle component is especially easy to misunderstand. Idle capacity is not necessarily waste in the simple sense. In a consumer-scale AI assistant, some spare capacity is the price of low latency and reliability. If all machines were perfectly saturated at every second, the service would be efficient right up until it became unusable. The trick is not to pretend idle capacity should be zero. The trick is to measure it, allocate it, and reduce avoidable idle time without breaking the service.
That is why the paper’s mechanism-first framing matters. Once the boundary is explicit, optimisation targets become visible.
If accelerator energy dominates, improve model architecture, quantisation, serving kernels, speculative decoding, batching, and hardware efficiency. If host energy is large, improve orchestration and CPU-side serving paths. If idle energy is material, improve placement, demand forecasting, and model movement. If overhead matters, improve data-centre efficiency and cooling. If emissions are high despite low energy, decarbonise electricity. If water is the local constraint, rethink cooling choices.
A single Wh-per-prompt number cannot tell you that. A decomposed boundary can.
The emissions number is small because energy and carbon intensity both matter
The paper reports 0.03 gCO2e per median Gemini Apps text prompt under the comprehensive method.
This is not just a function of energy. It also depends on the emissions factor applied to that energy. Google uses market-based emissions accounting, meaning the calculation reflects electricity procurement and associated environmental attributes rather than only the local grid mix. The paper reports Google’s net market-based emissions factor falling from 135 gCO2e/kWh for 2023 to 94 gCO2e/kWh for 2024.
That choice matters. Market-based emissions are legitimate within established greenhouse-gas accounting practice, but they are not the same as location-based physical grid emissions. A buyer comparing providers should ask which basis is being used.
This is where many AI-footprint debates become unnecessarily theatrical. One side wants to say “a prompt is tiny.” Another wants to say “data centres are eating the grid.” Both can be true at different levels of aggregation.
A median text prompt can be tiny. A product with billions of prompts can still matter. A provider can reduce emissions per prompt while total electricity demand rises. A company can use clean-energy procurement to reduce market-based emissions while still depending on local grids that vary by region and hour.
The paper does not solve all of that. It gives a measurement method for one important slice: serving a median Gemini Apps text prompt in production.
Water is measured as consumption, not just withdrawal
The water result is the most narratively dangerous because it is so easy to turn into a meme. The paper reports 0.26 mL of water consumption for the median Gemini Apps text prompt. That is roughly five drops of water using the paper’s standard 0.05 mL drop assumption.
Cue the inevitable “AI only uses five drops” posts. Please do not build an ESG dashboard from a social media caption.
The water metric is based on data-centre cooling water consumption, using a consumptive Water Usage Effectiveness approach. The paper distinguishes consumption from withdrawal: consumption refers to water evaporated or otherwise unavailable for reuse, which is more relevant to local water availability than gross withdrawal alone. Google reports an average WUE Category 2 value of 1.15 L/kWh for relevant data centres in both 2023 and 2024.
That is a reasonable accounting choice, but it has a boundary. Water impacts are local. A millilitre in a water-stressed watershed is not the same operational issue as a millilitre in a water-abundant region. The paper acknowledges this through Google’s water-risk framework and notes the role of air-cooled technology in high-stress locations.
For a business buyer, the useful question is not “how many drops?” It is:
| Procurement question | Why it matters |
|---|---|
| Is the water number consumption or withdrawal? | Withdrawal can overstate unavailable water; consumption can understate local operational pressure if used alone |
| Is the value fleet-average or site-specific? | Water stress varies sharply by location |
| Does the provider use water-intensive cooling in high-stress regions? | Local impact matters more than global average neatness |
| Is water allocated per prompt, per workload, or by compute share? | Allocation rules can change product-level claims |
| Are seasonal variations normalised or disclosed? | Cooling demand shifts with weather and climate |
The teaspoon is a nice metaphor. The watershed is the issue.
The one-year efficiency gains are main evidence, not a decorative victory lap
The paper reports a 33x reduction in per-prompt energy consumption and a 44x reduction in total emissions per median Gemini Apps text prompt from May 2024 to May 2025. This is one of the most practically important findings because it shows how quickly serving efficiency can change when model, software, hardware, utilisation, and electricity procurement improve together.
The authors attribute the 33x energy reduction to software efficiency, including a 23x reduction from model improvements and a 1.4x reduction from improved machine utilisation. The emissions reduction compounds energy efficiency with a 1.4x reduction in market-based emissions intensity and lower amortised embodied emissions per prompt.
The mechanisms listed are familiar to infrastructure teams but still worth spelling out:
- more efficient model architectures, including mixture-of-experts and hybrid reasoning;
- quantisation and narrower data types;
- speculative decoding;
- distillation into smaller serving-optimised models such as Gemini Flash and Flash-Lite;
- larger effective batch sizes while preserving latency;
- custom TPU hardware;
- reduced accelerator idling through dynamic model movement;
- compiler and kernel optimisation through systems such as XLA, Pallas, and Pathways;
- efficient data-centre operations and clean-energy procurement.
This is not one magic lever. It is compound interest across the stack.
That is also why the full-stack boundary matters. If a company measures only accelerator active energy, it may optimise the accelerator while ignoring host overhead, idle capacity, facility overhead, or emissions intensity. If it measures the whole serving system, it can see where the next gain actually lives.
The business translation is straightforward: AI inference cost curves are not fixed. They move with architecture, routing, batching, latency targets, hardware generation, utilisation, and electricity strategy. Any CFO treating today’s inference footprint as a permanent physics constant is doing accounting cosplay.
What each part of the paper is doing
Not all evidence in the paper has the same job. This matters because otherwise readers will treat every figure as if it proves the same claim.
| Paper element | Likely purpose | What it supports | What it does not prove |
|---|---|---|---|
| Measurement boundary definition | Main methodological contribution | A fuller production-serving accounting standard | That Google’s exact boundary is the only valid standard |
| Existing vs comprehensive energy comparison | Main evidence | Narrow accelerator-style accounting materially understates production-serving energy | That all prior studies are wrong or useless |
| May 2025 Gemini Apps prompt metrics | Main empirical result | Median Gemini Apps text serving footprint under Google’s infrastructure | The average, tail, multimodal, enterprise, or training footprint |
| Prior-work comparison figure | Comparison with prior work | Reported inference estimates vary widely because methods and boundaries differ | A clean apples-to-apples ranking of all providers |
| Emissions and water methodology | Implementation detail and accounting extension | Energy can be translated into emissions and water using stated factors | Universal environmental impact across all locations |
| One-year emissions-efficiency trend | Main evidence over time | Efficiency gains compounded across model, serving, hardware, and procurement | That future reductions will continue at the same rate |
| Appendix normalisation discussion | Implementation detail | PUE, WUE, and emissions factors vary by season, location, and technology | A full sensitivity analysis of every local deployment condition |
The paper is strongest where it uses first-party production telemetry to show how a comprehensive serving boundary changes the per-prompt number and reveals optimisation levers.
It is weakest if someone tries to use it as a universal footprint conversion table: “one AI prompt equals X.” That sentence should be approached the way one approaches a suspiciously cheap airport taxi.
What the paper directly shows
The paper directly shows three things.
First, a comprehensive production-serving boundary can materially change the energy estimate. The difference between 0.10 Wh and 0.24 Wh is not trivial. It shows that host systems, idle capacity, and overhead belong in the conversation.
Second, under Google’s Gemini Apps infrastructure, the median May 2025 text prompt has a low per-prompt environmental footprint by the paper’s definitions: 0.24 Wh, 0.03 gCO2e, and 0.26 mL water.
Third, per-prompt serving efficiency can improve dramatically over a short period. The reported one-year reductions—33x in energy and 44x in emissions—are large enough to make static estimates stale quickly.
Those are significant findings. They deserve attention.
They also deserve boundaries.
What Cognaptus infers for business practice
The practical use of this paper is not to paste “0.24 Wh” into every AI business case. It is to build better questions.
For enterprise buyers, cloud teams, and ESG leads, the paper suggests a vendor disclosure checklist:
| Disclosure item | Minimum useful question |
|---|---|
| Functional unit | Is the metric per prompt, per token, per response, per session, or per task? |
| Workload type | Is it text-only, multimodal, retrieval-augmented, tool-using, agentic, or batch inference? |
| Statistic | Is the number median, mean, percentile, or selected benchmark sample? |
| Compute boundary | Does it include accelerator, CPU, DRAM, storage, internal networking, and support models? |
| Capacity boundary | Does it allocate idle machines, failover capacity, and latency reserve? |
| Facility boundary | Does it include PUE and data-centre overhead? |
| Carbon method | Is emissions accounting market-based, location-based, or both? |
| Hardware lifecycle | Are embodied hardware emissions included? |
| Water method | Is water reported as withdrawal, consumption, or both? |
| Geography | Are values fleet-average, region-specific, or site-specific? |
| Time period | What month or year was measured, and how fast is the stack changing? |
This is the paper’s real business value: it turns “AI sustainability” from a vibes argument into an audit conversation.
It also reframes ROI. The same engineering work that reduces environmental footprint often reduces serving cost: better batching, lower idle capacity, quantisation, model distillation, serving-optimised model routing, and efficient hardware utilisation. Environmental measurement and unit economics are not identical, but they frequently point toward the same machinery. Convenient, when the accountants and the atmosphere briefly want the same thing.
Where the result should not be overused
The paper is careful about several exclusions, and the exclusions matter.
It does not measure AI model training. Training can be large, episodic, and amortised across use in ways that require a different allocation model.
It excludes end-user devices. That is reasonable because Google does not operationally control them, but it means the user’s phone, laptop, monitor, and local edge compute are outside the boundary.
It excludes external networking and treats data-centre networking for a text prompt as negligible. That may be acceptable for the studied case, but it should not be automatically assumed for all architectures, especially data-heavy multimodal or retrieval-intensive workflows.
It focuses on Gemini Apps text prompts. It does not give a direct number for image generation, video generation, long-context analysis, coding agents, multi-step research agents, enterprise RAG, or autonomous workflows that call tools repeatedly. A five-message agent loop is not one median text prompt wearing a trench coat.
It uses the median, not the mean. This is sensible because prompt energy distributions are skewed by low-utilisation models and high-token prompts. But median values describe the typical prompt, not the tail. For capacity planning and environmental risk, the tail is often where the spicy invoices live.
It is Google-specific. Google has custom TPUs, mature serving systems, enormous scale, clean-energy procurement, and highly optimised data centres. Smaller providers, enterprise self-hosters, and less mature inference stacks should not assume they get the same footprint by association. Proximity to a Google paper does not confer TPU efficiency by osmosis.
The misconception to avoid: tiny prompt, tiny problem
The wrong takeaway is that AI sustainability concerns are now settled because one median Gemini Apps text prompt is small.
The better takeaway is more precise: a well-optimised hyperscale serving system can make a median text prompt surprisingly efficient, and we now have a clearer template for measuring that claim.
That sentence is less viral. It is also less silly.
At scale, per-unit efficiency and total demand must be considered together. If the number of prompts, tokens, modalities, agents, and background automations rises faster than efficiency improves, total resource use can still grow. If efficiency improves faster than demand, impact per unit can fall even while service use expands. Both dynamics can coexist across different providers, regions, and products.
The paper helps with this because it discourages single-number theatre. It says: define the unit, define the boundary, measure the stack, report the components, and track changes over time.
For AI operators, that is the serious work.
The next standard should compare systems, not slogans
The AI industry does not lack environmental claims. It lacks comparable measurement boundaries.
One company reports accelerator energy. Another reports estimated model energy. Another reports water using withdrawal. Another reports consumption. One uses market-based carbon accounting. Another uses location-based. One reports average prompts. Another reports median prompts. One includes embodied hardware emissions. Another quietly leaves the hardware in a parallel universe where chips arrive by magic.
This paper does not solve comparability by itself, but it raises the floor. It shows that production-serving metrics can be instrumented across a real hyperscale AI product. That makes future vagueness harder to excuse.
A useful next standard would require at least three layers of reporting:
| Layer | What should be reported | Why it matters |
|---|---|---|
| Core serving energy | Accelerator, host CPU/DRAM, idle capacity, overhead | Shows the operational footprint of inference |
| Environmental conversion | Market-based and location-based emissions, embodied hardware, water consumption and withdrawal | Avoids hiding impact behind one preferred metric |
| Workload distribution | Median, mean, tail percentiles, token ranges, modality, and routing path | Prevents “typical prompt” from masking heavy workloads |
That would not make sustainability simple. It would make it harder to launder complexity through a charming decimal.
The real cost of a prompt is knowing what you counted
“From tokens to teaspoons” sounds like a story about turning AI into a kitchen measurement. The paper’s more valuable move is turning AI serving into an accounting boundary.
For the median Gemini Apps text prompt, Google’s comprehensive May 2025 estimate is indeed small: 0.24 Wh, 0.03 gCO2e, and 0.26 mL water. The company also reports striking one-year efficiency gains. Those are important results.
But the broader lesson is not that all AI prompts are environmentally trivial. It is that per-prompt claims are meaningless until the boundary is visible.
Did the number include the host system? Idle capacity? Data-centre overhead? Clean-energy procurement? Embodied hardware emissions? Water consumption? Which workload? Which month? Which statistic? Which geography? Which model path?
Ask those questions before sharing the teaspoon.
The future of AI sustainability will not be decided by the most memorable analogy. It will be decided by whether providers can measure the full stack, disclose it consistently, and improve it faster than demand expands.
Less poetry. More boundary conditions. A tragic loss for marketing, perhaps, but a small win for reality.
Cognaptus: Automate the Present, Incubate the Future.
-
Cooper Elsworth, Keguo Huang, David Patterson, Ian Schneider, Robert Sedivy, Savannah Goodman, Ben Townsend, Parthasarathy Ranganathan, Jeff Dean, Amin Vahdat, Ben Gomes, and James Manyika, “Measuring the environmental impact of delivering AI at Google Scale,” arXiv:2508.15734, 2025, https://arxiv.org/abs/2508.15734. ↩︎