When business leaders ask for a “quick chart,” they rarely expect to become detectives in the aftermath—trying to work out why the AI picked that chart type, grouped the data that way, or left out important categories. Yet that’s exactly the frustration with most Natural Language to Visualization (NL2VIS) tools today: they generate results like a magician pulling a rabbit from a hat, with no insight into how the trick was done.
A new research system called DeepVIS changes that dynamic. It integrates Chain-of-Thought (CoT) reasoning directly into the NL2VIS pipeline, showing not just the final chart but also the step-by-step logic that led to it—and letting the user interactively edit that reasoning without starting over.
The Problem with Opaque AI Visualizations
Traditional NL2VIS systems, especially those powered by large language models (LLMs), work like sealed boxes:
- User types: “Show sales by region for the past year.”
- Model outputs: A chart—correct, incorrect, or somewhere in between.
- Missing piece: Why it chose that chart type, grouping, and sorting.
Without transparency:
- Trust suffers — Users can’t verify the logic behind the visualization.
- Error correction is slow — Fixing a mistake often means rephrasing and regenerating from scratch.
- Learning opportunity is lost — Analysts can’t observe expert-like decision patterns from the model.
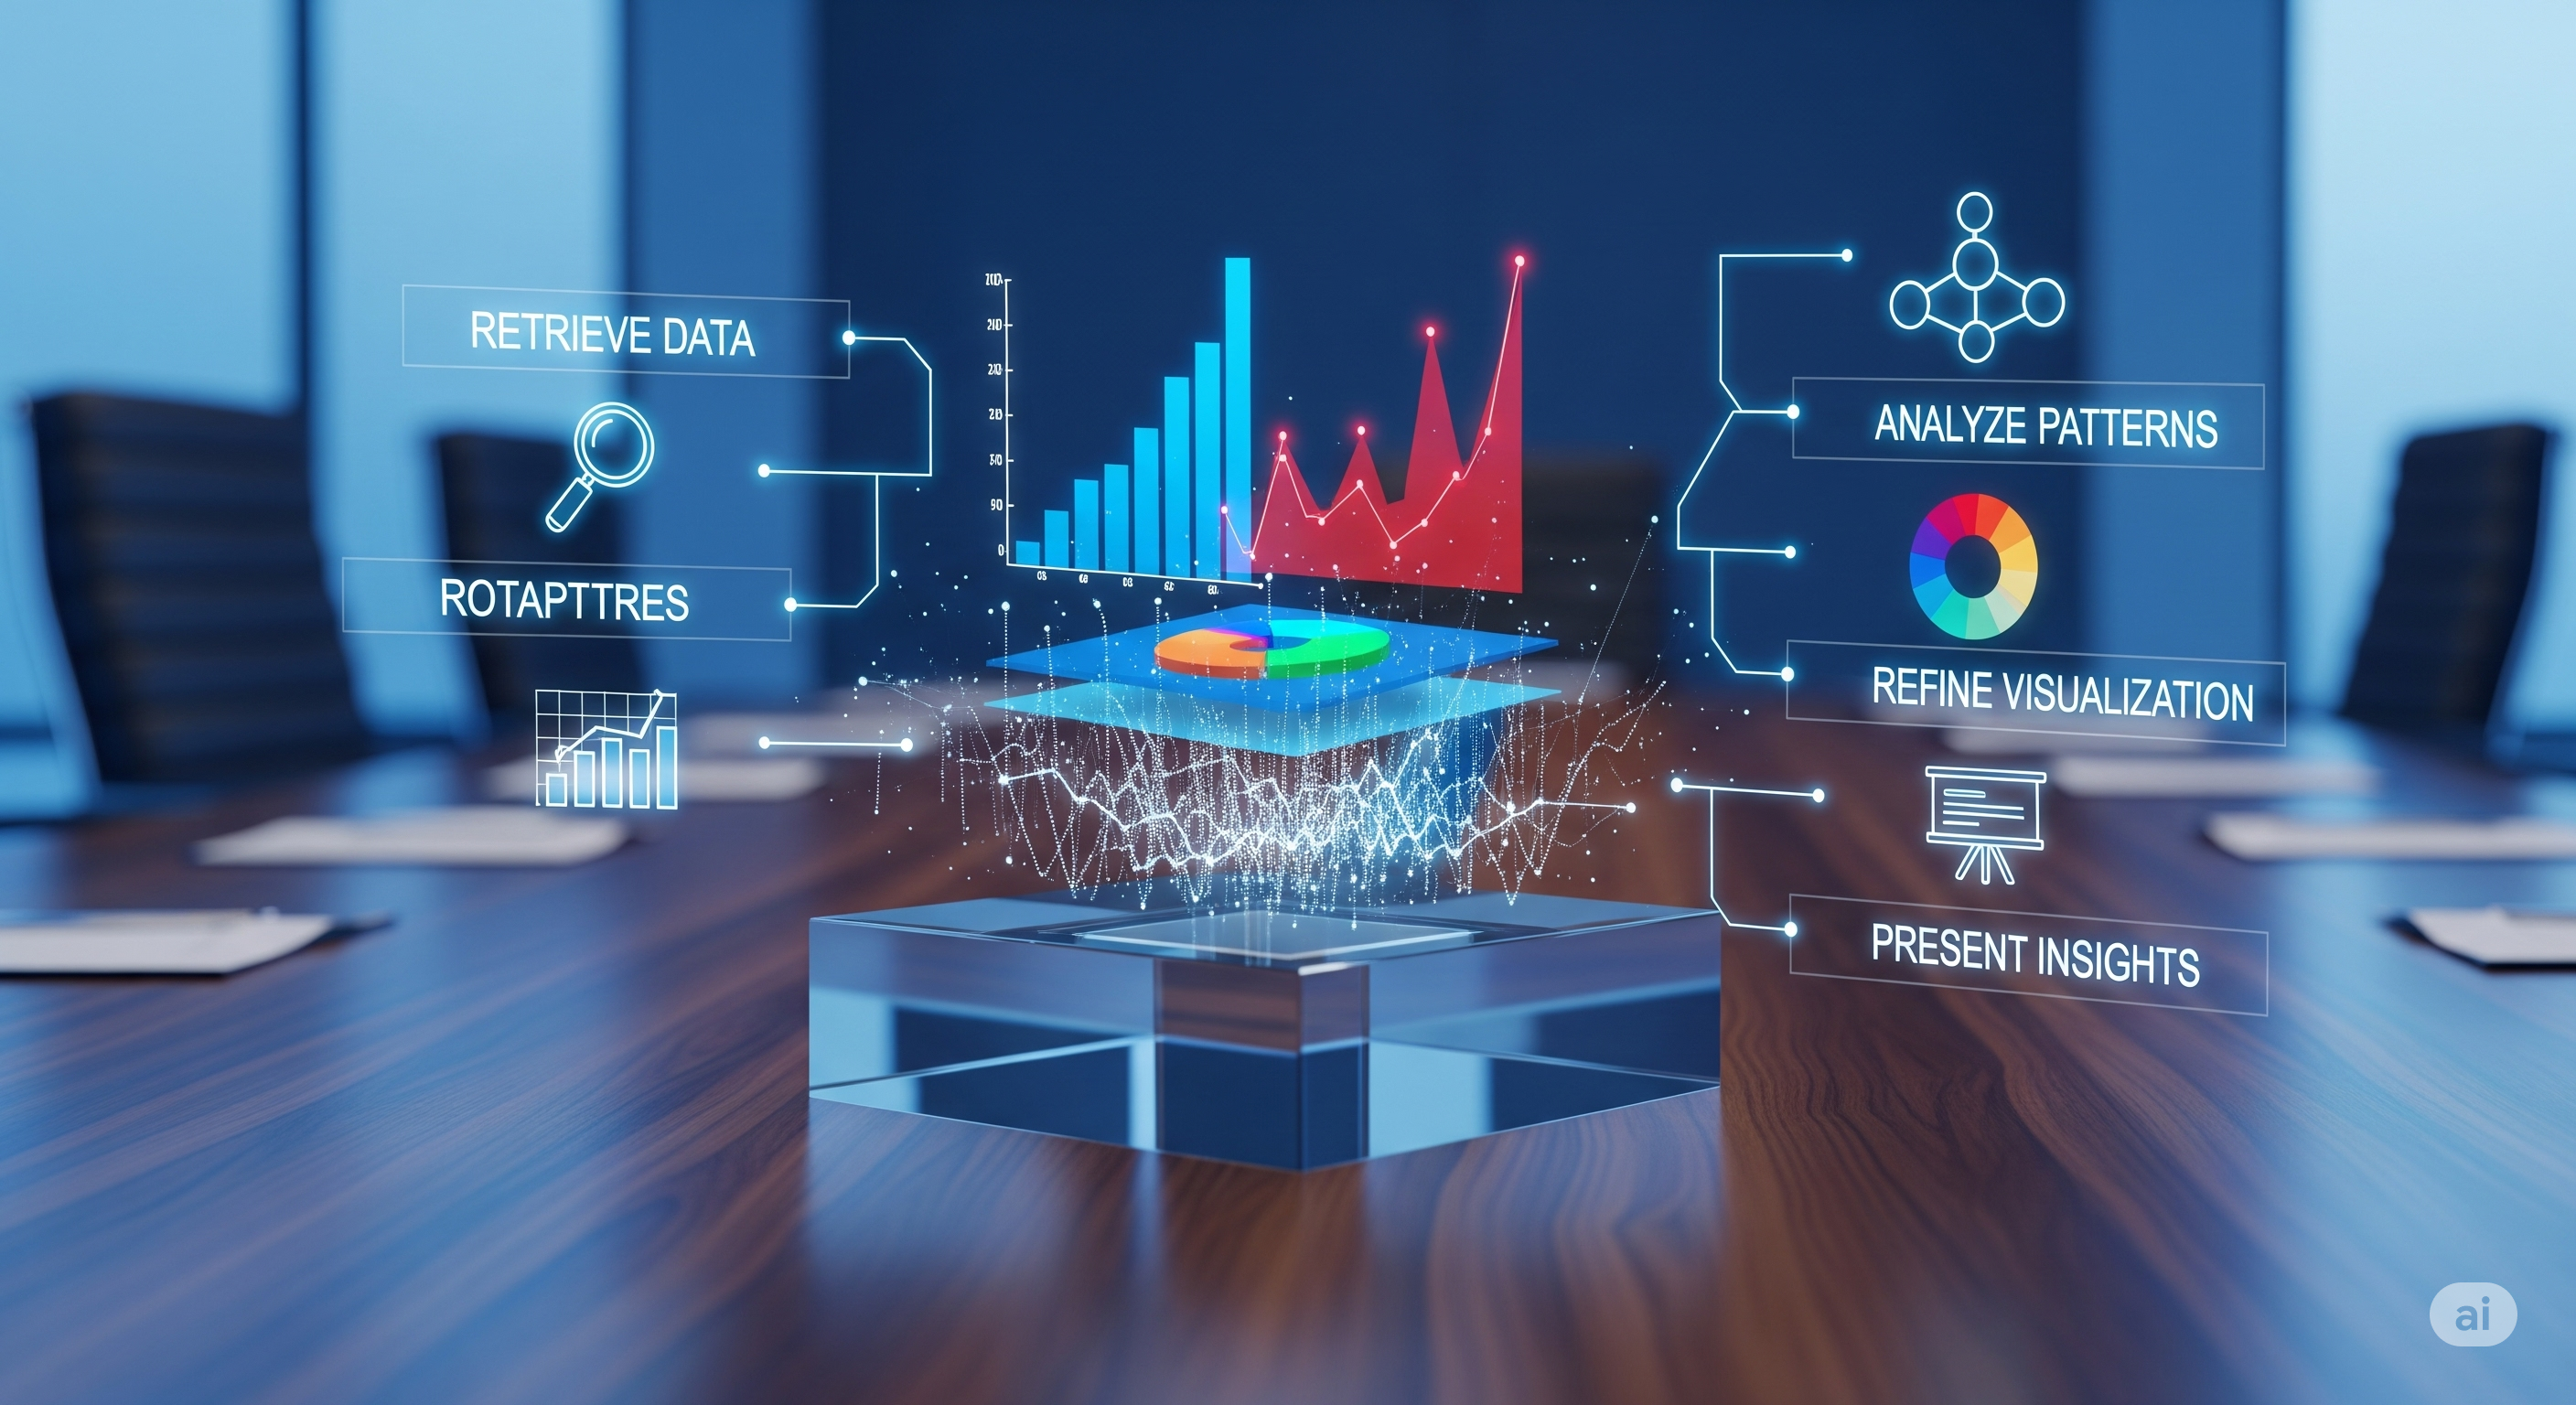
DeepVIS’s Five-Step Reasoning Framework
Through literature review and expert interviews, the researchers distilled human visualization design into a five-stage Chain-of-Thought process:
| Step | Purpose |
|---|---|
| S1 | Determine chart type – Match visualization form to analysis intent. |
| S2 | Retrieve relevant data – Select correct tables, columns, and filters. |
| S3 | Define data granularity – Group or bin data (e.g., monthly vs yearly). |
| S4 | Refine data for visualization – Apply sorting, limiting, transformations. |
| S5 | Generate visualization – Produce final VQL (Visualization Query Language) spec. |
These stages aren’t just for the model—they’re visible to the user inside DeepVIS’s interactive interface.
nvBench-CoT: Teaching Models to Think Aloud
DeepVIS isn’t just an interface—it’s backed by a new training dataset, nvBench-CoT, which augments a popular NL2VIS benchmark with:
- Schema descriptions: Clear table/column summaries.
- Value sampling: Example entries to avoid ambiguous SQL filters.
- Step-by-step reasoning traces: Explicit explanations for each CoT stage.
This data enables small LLMs (like Llama3.1-8B) to match or beat large general-purpose models in visualization accuracy—77.16% All Accuracy vs. ~71% for GPT-4o-mini in benchmarks.
The Interface: From Passive Viewer to Active Collaborator
DeepVIS presents three synchronized views:
- CoT View – A hierarchical map of reasoning steps.
- Chart View – Rendered visualization.
- Table & Information Views – The underlying data and full reasoning text for each step.
The killer feature: interactive refinement.
- Self-Correction: Model rethinks a decision automatically.
- Manual Correction: User specifies new preferences (e.g., change scatter to bar chart) and the model updates all dependent steps automatically.
Instead of throwing away the whole pipeline, users adjust only what’s wrong—saving time and mental effort.
Why It Matters for Business
DeepVIS isn’t just academic. In a business setting:
- Faster iteration: Adjust charts mid-meeting without a full re-run.
- Auditability: Keep a reasoning record for compliance or stakeholder review.
- Skill transfer: Junior analysts can see and learn from “AI thought processes.”
- Error prevention: Spot flawed grouping, wrong filters, or poor chart choice before they cause decision errors.
This is a glass-box model for visualization—transparent, correctable, and teachable.
Broader Implications
The CoT approach could extend beyond visualizations into:
- Data storytelling: Explain the “why” behind narrative visuals.
- Visualization debugging: Trace poor chart performance back to reasoning flaws.
- Multi-solution generation: Offer several valid chart designs for the same query.
For AI-powered analytics tools, the direction is clear: the era of “just trust the output” is ending. Business users will demand the ability to inspect, challenge, and co-create with AI.
Cognaptus: Automate the Present, Incubate the Future